A. ALLAM Engineer Principal, A., LANSARI Charged of Research
Laboratory of remote sensing, CNTS BP 13 ARZEW 31200 ORAN ALGERIA.
Tel : (041) 47-22-17, Fax : (041) 47-34-54
E-mail: allam_fethi@usa.com, lansaria@cnts.dz
The solar radiation that arrives to the surface of the earth is an important parameter for the knowledge of the solar layer in the regions where the solar energy is the most adequate means to make operate certain installation as the water pumps for example.
Algeria's surface is more than 2 millions of km2; a greatly sunny country, and include the moved back regions where the radiation data is almost non-existent.
In order to be able to fill the deficit in radiation data descended from the observation stations network the satellite imagery is the means permitting to inform on the temporal and spatial energizing state. The Meteosat satellite permits some continues observations in time - a picture every half hour - and cover a big part of the globe «42% of the terrestrial surface ».
Work presented in this study consists in the exploitation of the visible picture of combined Meteosat to the data descended from observations to succeed to the development of Algeria solar layer card.
The proposed method consists in the satellite picture exploitation not corrected of the atmospheric effects, combined to the data of station. The statistical treatment on the two types of data won't be altered.
Work presented in this study is a test of the evaluation of the solar flux to the soil from the visible pictures of Meteosat-5 and a set of global data radiation to the soil of the station of Oran.
This application consists in making a correlative study between the two types of satellite and station data. One will succeed to the establishment of the hourly cards of radiation to the soil from the regression gotten after have cross the two sets of data.
Key Words: Solar layer, satellite Imagery, statistical Treatment.
The world forecasting on the terrestrial natural resource life span (oil, natural gas, coal) show that they reduce considerably and that the man must move a lot more toward the renewable energies as the solar energy that remains inexhaustible to the scale of the humanity.
The transformation of the solar radiance in useful energy is one of the main preoccupations of the countries lacking energizing resources and particularly the greatly sunny countries as ours.
This energy presents the advantage to be inexhaustible but present the inconvenience to be variable in the time and in the space, what puts the problem of dimensionality of captation system as well as the storage of this energy. These aspects show us how much it is important to know the solar layer before the implantation of thermodynamic or photovoltaic systems of conversion of the solar energy.
In order to be able to propose the implantation of a solar energizing system, the designer must arrange, for every place considered of the knowledge the environment and to have the climatic parameters entering in the energizing simulation model also.
Since several years, numerous studies have been led and continue again to be able to quantify precisely this energy. The achieved studies are generally about the spatial and temporal distribution of the solar radiance to various scales of time (yearly, monthly, decadaire, daily and hourly).
The methods of evaluation depend on the nature and the number of available data on the site. Different approaches are possible, those that use the atmospheric models (spectral, analytic) that require an important number of atmospheric input parameters, and those that use the temporal interpolations (missing data in the time) or spatial (missing data in a region).
In the present state of research, the satellite pictures are not absolutely competitors but it is a lot more rational and profitable to use them like complementary documents. The practical applications of the remote sensing exist and develop strongly even if all phenomena are not completely included or modelisable.
The weak density of the network of measure of the solar radiance, have incited the researchers to elaborate several models of evaluation of the solar layer from the satellite and possibly combined pictures to the data of measure to soil to be able to calibrate the results estimated to the values observed by the instruments.
In this objective, the presented work represents an implementation of a method of evaluation of the sunlight to soil from the visible pictures of Meteosat-5 and a set of data of global radiance to the soil of the station of Oran.
This approach consists in making a correlative study between the two types of satellite data and station. we will succeed to the establishment of the hourly cards of radiance to the soil from the regression gotten after have cross the two sets of data.
The zone of survey corresponds to the region of Oran. It presents a semi-arid Mediterranean climate characterized by a strong temperature during the period of summer and therefore a continuous sun shire during the day and low temperature during the wintry season.
The zone considered, that represents 50x5O pixels around the central pixel correspondent in the station of Oran, for which one supposes that the evaluation of the light is meaningful, include the wilaya of Oran the one of Mostaganem to the East the one of Temouchent and Sidi Belabes in the West south and the one of Mascara to the south is.
The data used in our survey are constituted of a set of satellite pictures of Meteosat-5 and another set of data recorded to the soil by the instruments of measure.
The set of satellite pictures, is obtained from ESA (European Space Agency), the data are compressed in a CD (Compact Disc) between June 1994 and June 1995.
We extracted one month, corresponding in July 1994, therefore of data of visible pictures of GMT l2h full resolution (1896x920). The month of July has been chosen because it includes the less cloud on the region of survey.
Nevertheless we have been obliged to eliminate a certain number of pictures presenting some clouds.
We used all pictures of the month of July 1994 with the exception of the pictures of the days of the 3, 5, 8, 24, 30 and 31,.
The number of pictures treated is therefore of 25, full resolution (under - satellite: 2,5x2,5 km) in GMT l2h. We limited ourselves to the following dimension of the picture (720xl4O) because she/it covers the region of survey that corresponds to the Oranie well. The numeric account of the pixel is coded on one byte (8 bits), corresponding to 256 levels of Gray (of 0 to 255).
For reasons of availability, the data land used in this survey is relative in the month of July 1994 of the station of Oran. The data extracted of the main file, correspond to the hourly global radiance recorded in GMT l2h in the station of Oran (National Office of the Meteorology). The data are expressed in Joule.heure/cm2.
The analysis of this set of data indicates us that the raised measures are homogeneous and that the received radiance quantity in GMT l2h is compliant to the theory.
The developed method leans on a set of stages relatives:
- To the treatments of the pictures satellites and the data of radiances to the soil of station,
- And of statistical treatments that consist in establishing a degree of correlation between these two types of data
- And to test the degree to validate this correlation.
The elaborated method leans on a certain number of physical treatments of the satellites pictures radiometry, data of the land's observation and statistical treatment. This gait is organized in different stages, of which each is retailed as follow:
I stage:
This stage corresponds to the applied treatments to satellites data, it contains:
- The extraction of a small image (720xl40) of the original picture (1896x920). This operation is achieved from the software Paint Shop Pro Software Version SHAREWARE 3.11, on the set of the pictures of the month of July 1994 (25 pictures).
- The conversion of the numeric account (CN) in Radiance of Lsat lighting, the luminance reaching the visible sensor embarked on the Meteosat-5 satellite is given by the relation:
Lsat = a (CN - Co)
Where:
CN: is the numeric account recorded by the sensor,
Co: is the account of offset characterizing the detectable minimal numeric account by the radiometer of the satellite. The value given by the constructor for the month of July is Co = 5
The conversion of Radiance of Lsat brilliance in Esat lighting to the entry of the satellite:
If we consider that the satellite aims a Lambertienne surface, which means that it receives the same quantity of energy in all directions, then the light that arrives to the entry of the sensor is : ![]()
Thereafter we applied on the set of the small images 720x140 pixels the above-stated treatment, and we get then, the lighting's pictures of the Meteosat-5 satellite.
These operations have been achieved with the ENVI-2.5 Software version.
II stage:
It corresponds to the picture mapping, from the geographical position of the town of Oran, of the pixel the correspondent. For it one uses a program of conversion (latitude - longitude - pixel) developed in E. S.A.
Because the weak spatial resolution of the picture, the location of the corresponding pixel to the city of Oran, generated mistakes of positioning of the order of one to two pixels.
To this effect, and for required reasons in our calculations we have estimated that only the results gotten on a square of 50x50 pixels are representative of the region of Oran.
Once the mapping done, we proceed to the reading of the Esat lighting on the picture. The operation is executed for every picture (25 pictures).
III stage:
In this stage the statistical treatment is approached. The survey of the correlation between the two types of data will permit us to determine the coefficient of correlation as well as the equation of the regression line.
Once the equation of regression established, from the data of which one arranges, the graphic representation of the cloud of point as well as the adjustment by this right of the linear shape of y = a x + b, has been established by the software WINGRAPH.
The equation of regression is: it y = 0.306895 x + 71.112022
The correlation coefficient calculated by the software EXCEL Version 5, gave the value of
R = 0.733647
The graphic representation, of the cloud of point as well as regression line, is indicated as follow:
Fig. 1
Thereafter the control of the efficiency of the regression line, has been proceeded the statistical correlation was applying to validate the results:
The correlation statistical test:
Determination of the error - type of evaluation of y from the value of X
Sy : the error - type of evaluation
sy : gap-type of y (y: set of the data observed)
R: the correlation coefficient.
This coefficient translates the error of estimated value of y (correspondent to the lighting estimated) from the known value of x (correspondent to the lighting deducts from the picture).
We notice that the error - type decreases when the correlation coefficient increases and that it is especially raised that the scattering of y increase.
While tolerating 5% of error, there are 95% of luck so that the valued solar light of the picture is consisted directly contained between Y- 2 Sy and Y+2 Sy, by definition of the normal law.
It follows that the evaluation of the solar light is of ± 4.96 W.hr/m2. Therefore the error of tolerance is admitted to the threshold of 5%.
Degree of significance of the linear coefficient:
We want to know if the correlation found between the solar light estimated by the satellite data and those observed are attributable or no at random or that a relation really exists between the two studied variables.
For it the statistical of Student is used:
So the value of t of Student gives us the critical value depending on whether the calculated correlation coefficient is meaningful or it is not (Table 60.15).
Concerning our set: calculated t Student is worth 5,18 that are extensively superior to the t criticizes 2.807 given by the Table 60.15 and the coefficient of correlation calculated R = 0.733647 that are superior to the critical R value = 0,505 extracted.
From the table 60.15, therefore the correlation coefficient R is meaningful to the threshold of 1%.
IV stage:
After validation of the regression and the R coefficient, the following stage corresponds to the application of the equation of the regression line on the set of the pictures, to get the evaluated lighting.
We get the lighting cards of the region of Oran, including the adjacent cities.
V stage:
This last stage corresponds to the formatting and the dressing of the lighting cards.
For the practices reasons the equation of the line's regression is applied on the set of the small image (720xl4O pixels). We consider only the results gotten in the square, constituted of 50x5O pixels, are representative of the estimated lighting of the region of Oran.
A palette of colour has been assigned to the set of the cards of solar light in order to distinguish between the different chosen lighting ranges.
The dressing of the cards has been achieved so that it indicates the title of every card, the kilometrer scale, the legend and the geographical reference mark.
As being based on the histogram of the picture we have determined according to the frequencies of apparition of the light the minimum and the maximum correspondent to the continent, and delimited our classes. The colours of the palette have been chosen so that one distinguishes the different classes of estimated lighting.
For it, it has been affected the following colours:
- Blue for lighting between 0 and 99.99 W.hr/m2
- Red for lighting between 100 and 109.99 W.h/m2
- Green for lighting between 110 and 119.99 W.h/m2
- Magenta for lighting between 120 and 129.99 W.h/m2
- Yellow for lighting between 130 and 139.99 W.h/m2
- Cyan for lighting between 140 and 149.99 W.h/m2
- Corral for lighting between 150 and 159.99 W.h/m2
- Brown for lighting between 160 and 255 W.h/m2
First of all the methodology that we adopted in this work only applies on pictures in clear sky.
The results gotten of the estimated lighting are solely representative for the region of 100xI00 km2 centred on the city of Oran, because we only had data of radiance of the station of Oran.
In a global manner, this region presents a predominance of the lighting comprised between 110 and 120 W.hr/m2.
The gotten results are then satisfactory compared to the data of available land.
The results would have been better if one had a denser data network data.
The limits of this method, of the lighting evaluation resident mainly in the following points:
- The data land being prompt and built-in in the time contrary to the spatial data that they are integrated in a surface of 6.25 km2 and instantaneous in the time.
- The spatial data have not been corrected of the atmospheric effects.
The evaluation of the lighting to soil is a work that requires a light number of data (pictures satellites and data lands) if we want to succeed to a rigorous lighting card.
The elaborated method in this work is a draft of gait that remains perfectible considering the treatments brought to the satellite picture and the data of radiance.
The gotten results are then very satisfactory. They will permit to have light data in quasi - real time and in any accessible region or not, and will serve to the possible potential users in the domain of power solar.
In term of perspective, this work could be continued in increasing the number of pictures per day to have a daily evaluation and increasing the number of station of measures, and finally with applying to the satellite pictures an atmospheric correction. We will finally have a set of daily, weekly, monthly or hourly cards of a region of our choice or the choice of the potential user.
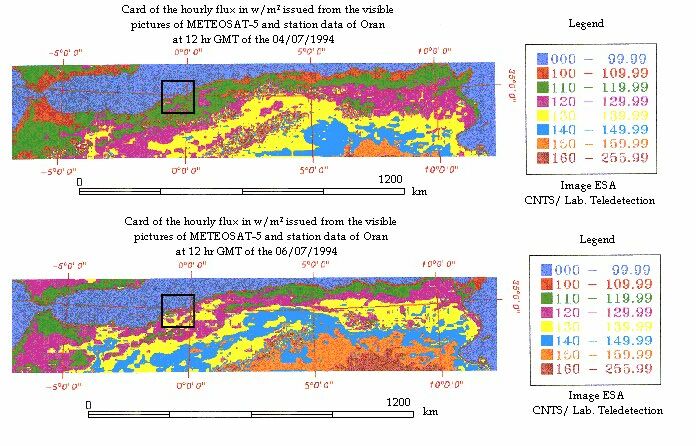
Fig. 2