Nikolas Prechtel & Manfred Buchroithner
Dresden University of Technology
Institute for Cartography
D-01062 Dresden, Germany
E - mail: Nikolas.Prechtel@mailbox.tu-dresden.de, Manfred.Buchroithner@mailbox.tu-dresden.de
The efficient provision of topical, extensive and reliable geo-information is a condition for concrete environmental protection and ecological planning. This is not solely valid in the 'western world', although primary information is comparatively transparent and mostly easier accessible there.
The presented German-Russian co-operative research project aims at a geoscientific-methodological contribution to help protecting the unique natural environment and the cultural variety of the Russain Altai Mountains which approximately coincide with the administrative borders of the Altai Republic within the Russian Federation. Success or failure of ecological measures depend on integral planning which includes the socio-cultural environment with emphasis on the indigenous population. The advantage of geo-information systems for structuring, homogenisation, integration, analysis and presentation of the necessary informative foundations is undisputed.
The principal objectives of the superordinate "Altai Project" are environmental geo-data capture, GIS integration and thematic map production for a mountain area of 10,000 km2. The main application fields for the GIS and the derived maps are seen in conservation, planning, and mountain research. In its type, the "Altai GIS" is unique in Central/High Asia and can claim to rank among the most comprehensive spatial geo-data base of all these regions.
The Russian Central Altai, the closer sphere of our work is an economically underdeveloped and peripheral area within the Russian Federation, which can more likely be counted among the losers of the political and economical transformation of Russia. Markets for animal products and timber got lost, the weakly developed light industry did not resist the newly emerging competition. The economical and cultural exchange of the border region with the neighbouring countries Mongolia, Kasakhstan and China is feeble. Recent development projects, for example a Trans-Altai road link over the Ukok-Plateau, have to be seen critically as singlular schemes, because they could impair the ecology and eventually disturb the labile economical balance of the neighbouring areas. The welcome declaration of spatious nature reserves (all together more than a fourth of the Altai Republic's territory) is in danger to be a label only, as long as management and informational foundations are retarded. Conservation management needs to be embedded into integrative development planning, the principal goal being the improvement of the social situation. One of the perspectives is, for example, a socially and environmentally friendly tourism. Presently tourism is spatially and quantitatively very limited, hardly ever supported by infrastructure, directed or controlled. Consequently, it hardly contributes to the regional welfare. The promotion of eco-tourism can and should rely on the same geo-information sources as conservation activities.
The principal study area is encompassing contiguous protected zones in and around the Katoon-Range within the Central Altai (brief description e.g. by PRECHTEL 1998, more extensive e.g. by BUTWILOWSKI 1993). Moreover, a larger spatial context - the whole Russian Altai Mountains - is mirrored in our activities, wherever the spatial scale of data and the theme is demanding this. There are different responsibilities: the Russian Federation for the 'Katoon Zapowjednik' since 1991, the Altai Republic (a partly autonomous state within the Federation) for the 'Beloukha Nature Park', and the UNESCO for the World Nature Heritage Area since 1998 (part of the so-called 'Golden Mountains of the Altai'). This principal study area is only one focus of environmentalists, some 25% of the Russian Altai Mountains have a protection status (KAISER & KÖNIG 1998). Their ecological value is well understood by the government and international organisations including NGOs, but contrasts with deficiencies in the de-facto management and the environmental awareness at the place. Several landscape zones are crossing the borders to Mongolia, Kasakhstan or China, and would profit from multi-national co-operative planning and steering. A dominant environmental intactness must, however, rather be attributed to a low pressure from a small indigenous population and few visitors than to an efficient environmental management. Unfortunately, it is nevertheless endangered: threads origin from historic events like fallout from the Semipalatinsk nuclear test plant, but also from recent ones: wild camping and littering, frequent man-made forest fires, disturbance by trophy hunting parties and dodgy adventurers, etc.
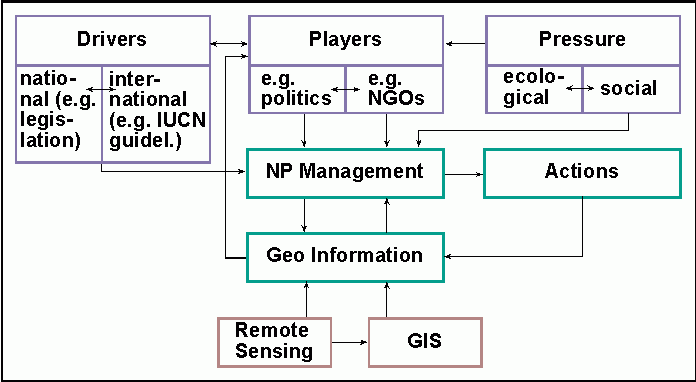
The following figure shows - in an abstract way - the tension field, which is connecting conservation, its political environment and information requirements:
Figure 1: The interaction between environmental driving forces, the national park management and its information demands.
Since 1996 a collaborative long-term project of the Altai State University in Barnaul and the Institute for Cartography of the Dresden University of Technology has been working on an informational base for environmental management. GIS and Remote Sensing is extensively used without neglecting traditional map products as principal output. We believe, that a spin-off of such a project might also be some promotion of eco-tourism (PRECHTEL & BUCHROITHNER 2001). Because of an economically weak state of the area and little prospect for recovery of its traditional base (life stock, forestry and mining at some spots), an environmentally friendly tourism might be a potential loophole.
In the following, the general contents and some strategies of data organisation will be out-lined.

Figure 2: Map of the Altai Republic generated from GIS 'ALTAI 1000'.
Even if reliable maps might be of greater help for the local conservationists at the moment, a rigid GIS integration and secondary map production has proved to be the best solution. The GIS is much more than a digital map drawer. New data qualities are created through:
In the initial phase most work was centered around a topographic data base. In this context, some exemplary benefits of the GIS solution may be sketched:
A lot of problems of extracting relief information from topographic maps could be cured by numeric methods, like detection of missing contours and edge matching by co-ordinate transformations. Z values could automatically be assigned to drainage arcs at contour intersections and intermediate sections be interpolated. Geometrical residuals between map-based and photogrammetric 3D points could be localised and freed from biased errors.
The drainage network, a major part of any topographic model, could be introduced in a consistent form as network model with node elevations (while a map typically uses combinations of 1D and 2D representations according to the width of a stream channel; PRECHTEL 2002). This, in turn, allowed not only to calculate drainage profiles, but also to trace back a whole drainage system or, in connection with the DEM, to derive catchment areas.
A GIS is only nominally a scale-free structured data set. In reality, all input, be it vector or image data, is directly or indirectly linked to scales for reliability at any spatial query and also with respect to visualisation restrictions. The geo-data base (DTM, drainage network, communication etc.) plays a key-role concerning the global generalisation level. In Russia official topographic maps are only available at scales 1 : 200 000 and smaller. The multispectral image data of the Russian MK4- (with stereo capability) and the Indian LISS-3 sensors correspond fairly well with this scale class, regarding both their geometric resolution and stability. Besides the maps, so far this imagery forms the backbone of all information retrieval. Consequently, the main scale for sensible GIS applications can be indicated to be situated between 1 : 100 000 and 1 : 200 000. Some exploitations of specific image contents, however, will exceed the actual average accuracy standards and allow improvements of the map-based geo-data base (e.g. settlement delineation and 2D drainage reconstruction).
Some not exhaustive detailed studies (e.g. glacier cover and spotwise geomorpho-logical surveys) have been carried out, which will not fall into this main scale class. Their reference scale is 1 : 25 000 or larger. Nevertheless, they have been imbedded into the main structure, but specifically labelled to account for the difference.
The detail level of other data covering an area far beyond the inner study area has been taken from small-scale maps. It is allowing only representations in scales of approx. 1 : 500 000 (e.g. geological structure, climate elements etc.). Therefore, a separate generalised geo-data base of the whole Altai Mountains has been created.
As derivable from the above statements, the sketched structure arrives at a two-level GIS model. A clear division concerning sources, geometric and semanitic quality is guaranteed through meta-data. Links between the levels are realised about homologous node attributes or IDs. These links are primarily relevant for navigation and not for a combined analysis or graphic representation.
While working on the data base for the inner study area, amounting to some 10% of the Altai Republic's territory, it became clear, that some themes would require a wider spatial context. A decision for a multi-scale approach was made to account for:
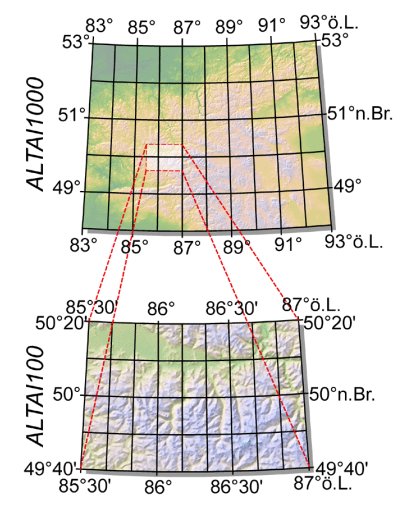
Figure 3: Extension of the areas covering the 2 levels of the Altai GIS.
This context area has been defined as the complete mountain system of the Russian and Mongolian Altai including its fringe with the southern parts of the West Siberian Plate in the north, the Kasakhian Ridge in the west, and the cold Mongolian salt lake steppes in the east. The coverage is defined by a lat/long mesh with a south-western corner at 48° N, 82° E and a north-eastern corner at 53°N, 93°E. One typical application of the small-scale model is meteorological and climatic research including the wide-area snow distribution. A tabular data base has already been ingested to contain temperature and precipitation records from most of the Altai Republic meteo-stations. Also communication with low-resolution satellite meteorology can well be realised via this data base.
A brief overview on the technical parameters and the contents of the two GIS bases termed ALTAI 1000 and ALTAI 100 is presented in Table 1.
Table 1: Comparison of small-scale (Altai1000) and medium-scale GIS (Altai100) data structure. Fields containing a (P) are currently under construction.
|
Altai-1000 (Overview Model), Lambert's Conformal Conical Projection, Cent. Meridian 87°E, WGS84 Spheroid, Coverage 48° N to 53°N and 82°E to 93°E |
Altai 100 (Detail Model), Transverse Mercator Projection, Cent. Meridian 87° E, Krasovsky Spheroid, Coverage 49°40'N to 50°20' and 85°30' E to 87° E |
|||
|
Category |
Info-Layer |
Primary Source(s) |
Info-Layer |
Primary Source(s) |
|
[1] Relief |
raster DEM |
reprojected and resampled from USGS GTOPO30 |
raster DEM |
TopoMaps 200,000 and MK4 (stereo) satellite images |
|
raster DEM |
digital image correlation from CORONA stereo imagery |
|||
|
lines and points |
contours calculated |
lines and points |
contours (rock & glacier), |
|
|
raster (B&W): hill shading – raster (RGB): elevation tints |
analytical generation |
raster (B&W): hill shading – raster (RGB): elevation tints |
analytical generation |
|
|
[2] Drainage |
lines: rivers (name, order) |
ONC Maps 1,000,000 |
lines: rivers (name, order, slope) |
TopoMaps 200,000; partial improved by delineation from images |
|
polygons (catchment areas with ID) |
analytical generation |
|||
|
[3] Trans-portation |
lines (type of commun. link) |
ONC-maps 1:1,000,000 |
lines |
TopoMaps 200,000; |
|
[4] Settle-ments |
points |
ONC Maps 1,000,000 |
polygons: settle-ment outline (name) lines: streets (P) |
TopoMaps 200,000; internal street network from high-resolution images |
|
[5] Forest Cover |
polygons |
TopoMap 500,000 |
polygons |
TopoMaps 200,000 |
|
polygons (vegetation classes) |
reclassified from Global Land Cover Characterization |
raster |
MK4- and IRS-1C LISSIII multispectral ortho-images and field observations |
|
|
[6] Glaciers |
polygons: glacier outlines |
TopoMap 500,000 |
polygons, lines |
TopoMaps 200,000 |
|
polygons (partly 3D) (dates, surveyor, device) (P) |
high-resolution imagery GPS measurements |
|||
|
[7] Other Land Cover |
polygons |
basically from various image data |
polygons: |
from actual multispectral imagery |
|
polygons: |
from actual multispectral imagery and field observations |
|||
|
[8] Admini-stration |
polygons |
ONC maps 1,000,000 TopoMap 500,000 |
polygons (country, rayon, protected zones) (P) |
TopoMaps 200,000 and other documents |
|
[9] Meteorology |
points: meteo-stations (attributed) |
existing data sheets |
||
|
raster and polygons: snow cover (date) |
from AVHRR satellite data for the years 1997 and 1998 |
|||
|
[10] Morpho-logy |
polygons: maximum Pleistocene ice extent (unclassified) (P) |
research documents of |
polygons |
analytical from DEM, field survey and high-resolution imagery |
|
[11] Important facilities |
points |
diverse documents and field survey |
points |
diverse documents and field survey |
|
[12] Terres-trial digital photo-graphs |
points: (IDs) (P) |
from field campaigns |
||
In any ecological model of a high-mountain landscape, relief information takes a central position. Most natural processes are linked to primary (cell elevation) or secondary relief properties (slope, aspect, complex morphological unit). A start with the relief was, apart from subsequent modelling, also technically a must. All high-resolution satellite imagery had to be rectified with a precision, that allows multi-sensoral image layer stacking. A rigorous geometric reconstruction of the data take configuration requires a DEM.
In 1995, at project start, no regional DEM matching the minimum accuracy requirements was at hand. One had to begin with map digitising. The available 1:200,000 scale was rather small, but the sheets had a very detailed relief portrayal. Their most severe shortcomings are: change of the contour interval between the sheets, partial edge mismatching, and 'no-data islands', where rock drawing excludes any quantitative information extraction. Gaps were photogrammetrically closed with MK-4 space photographs of decent quality. The measurement areas were blown-up to create data overlaps. Two point sets - map-based and image-based - could thus be compared. Discrepancies (from imperfect exterior image orientation, map generalisation etc.) were detected. A systematic contribution to the residuals could mostly be eliminated. An estimated standard altitude error of the DEM lies around 35 m, but there is no sound reference which allows a valid statistical evaluation.
While a substantial effort was directed to a new digital elevation model for the ALTAI 100 GIS, the huge coverage of ALTAI 1000 could only be filled with relief information from the popular GTOPO30 data which is globally available for land areas. The data set has been prepared by the U.S. National Imagery and Mapping Agency (NIMA) and forms a backbone for small-scale models until an improved global data set might eventually be provided from interferometric radar data of the SRTM mission. As indicated by the name, the original grid spacing is 30 arc-seconds or about 900 m in meridional direction. The original DEM was reprojected to the Lambert Conical Projection (cf. Table 1) and resampled to square cells of 500 m x 500 m to fit the other data. Due to multi-source input to the original DEM, a homogeneous quality cannot be assumed. The combination with the various vector layers of ALTAI 1000, however, proved a good correspondence, especially with the drainage network.
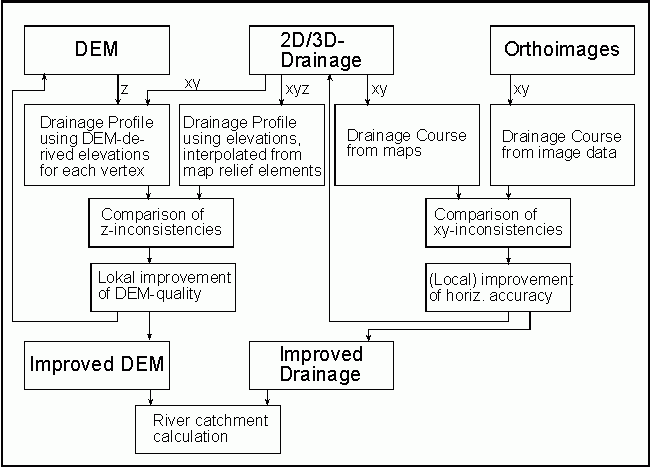
Figure 4: Flow chart showing the harmonisation problem exemplified by interactions of digital terrain model and drainage elements.
Subsequently thematic (in the sense of non-topographic) layers had to be placed on top of the geo-data base. The work sequence was determined by ecological priority (relevance for eco-management), data availability, type and state of primary data for further processing (e.g. satellite images and survey recordings), and the commensurability of working hours dedicated. Every thematic addition, however, extended the modelling potential of the GIS and, with the help of consistency checks and corrections, its overall quality.
In a high-mountain area the physio-geographic components are closely related with respect to their absolute location and to their spatial patterns (e.g. forest stands or glaciers with relief). If one accepts, that - highly generalising - the biotic landscape components are rather reactive in character and the abiotic ones the primarily steering components in the area under consideration, then the main direction of the present work might become clear:
Further geo-components call for an integration to the GIS (e.g. petrography and geological structure, soil types). However, the available analogue information will only allow relatively coarse delimitations or exemplary statements.
On the biotic side, the classification of forested areas has been performed on the basis of satellite images (compare geo-data base) and delivered more than a binary forest mask, namely a basic classification of closed stands. The classification of the high-montane and alpine belt outside the forest, which is by now envisaged with high priority, will hopefully add further vegetation and other land cover classes (rock/debris, alpine meadows, wetlands with herbaceous cover and with wooden constituents).
The completion of the additional thematic layers mentioned above will pave the road for more complex questions, e.g. habitat modelling of selected animal species. Also, a more rational steering or control of critical activities (camping, mountaineering, hunting) might then be facilitated.
The described "Altai GIS" representing the result of intensive fieldwork and in-house activities since 1996, is supposed to be one of the most comprehensive remote area mountain GISs world wide, both in terms of area extension, number of thematic layers, and degree of detail. The generation of a high-quality DTM and the investigation of different remote sensing data sets yielded new methodological developments. The spatial data form an ideal base for the management of protected landscapes in the Altai Mountains and further planning
The financial support by the German Federal Ministry of Education and Research (BMBF) and the NATO Science Programme is much appreciated.