Amar Dif 1,Samia Zaitra 2 et Moulay Idriss Hassani 2
1: Centre National des Techniques Spatiales (CNTS)
BP 13 Arzew, 31200 Oran, ALGERIE
adif@usa.com
2: Université d'Oran Es-Senia (IST)
The semi-arid climate is characterized by precipitations with high intensity and short period, which generally provoke torrential rains. In the case of the watersched of these zones, the hydrologic answer is dominated by processes of surface flow. The progress of waters is controled largely by the shape of the hydrographic network and the topography of the terrain.
The ramifications of the hydrographic network in the mountainous zones and the itineraries in the plains zones change with time which makes their update an indispensable operation before all temptation of hydrologic survey.
The satellitale imagery supported by 3D visions can be used like a ideal cartographic basis for the update of the hydrographic network.
In this work, remote sensing and the Digital Model Elevation (DME) have been used to produce some recent orographiques (Hydrographic) charts.
The LANDSAT-TM image (30m * 30m), permit to provide all details concerning the zone of stady, in particular the linear structures (river). These permit to distinguish between two types of networks:
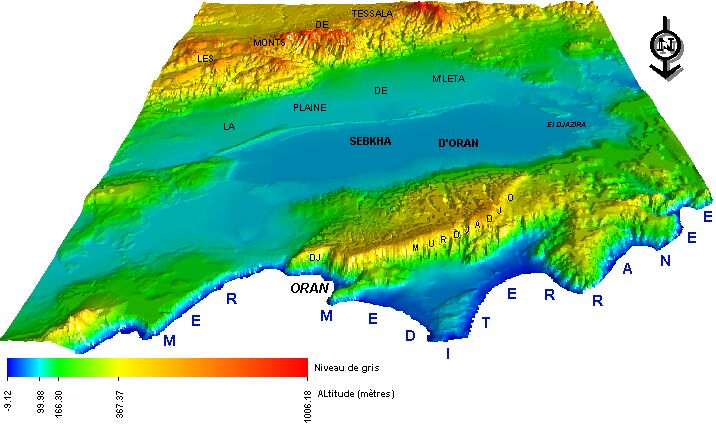
The region of study is situated in the external zone of the tellien domain. It is comprised between two sets of mountains, the mounts of Tessala to the south, culminating at 1061 meters (pick of the Tessala) and the mounts of the Murdjadjo to the North, culminating at 584 meters to Me sabih. These two sets form between them, the big endoreic basin named the watershed of the big Oran sebkha. The sebkha is constituted of a big extended saline lake, surrounded by a set of plains juxtaposed in the north (plain of Misserghin, Amria, Bou-Tlelis, etc.) and to the south a very extended plain (plain M' leta). Fig n°: 1
Fig n°1 : View in 3d (DME) of the zone of study.
Geographically, the zone of experimentation is localited between the meridians (0° 45 (and 0° 55 (W) and the parallels (35° 20 (and 35° 30 (N). Fig n°: 2
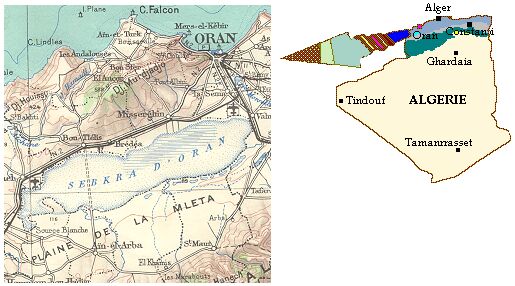
Fig n° : 2 : geographical Situation
For our survey, we used of the Thematic Mapper 5 images of March 17th, 1993. Their use has been limited to take out again the hydrographic network and the sub watershed in order to restore the topographic charts to the scale of 1/50 000ieme.
A trichromie (RVB) has been established with the combination of the channels of the visible and the near infrared (TM1, TM3 and the TM4).
The result of this colorful composition has essentially been put in evidence from a key of interpretation of the constituent elements of the based physical environment on the tonality and the shape. The linear elements as the long-haired hydrographic which are well discernible by their shape dendritique observed in the zone of study.
Our choice has especially been focussed on this trichromie, after several trial operations, because of its richness in information for the theme of the hydrographic network legible and easy to follow the most downstream until the point which is the outlet.
The method used consists of an analysis that takes into consideration the parametres : tonality or color, texture and structure, and finally the shape.
The shape of a river is an important parameter to take into consideration in the tracing of the hydrographic network.
The setting up of the tracing of the long-haired hydrographic from the picture present some difficulties. In fact, the manual follow up of the superior orders (ordres : 1, 2) on the picture is a long and heavy operation. To solve this problem we used the tracing of the network of the topographic chart to the 1/50 000ieme (Fig n0: 3).
In the plains, the follow-up of the tracing depends on the date of the shooting and the surrounding context (problem of the streams under forest table setting, problem of the hierarchies in the urban zones, etc.). The observation errors can generate a chaos in the hierarchization of the hydrographic network.
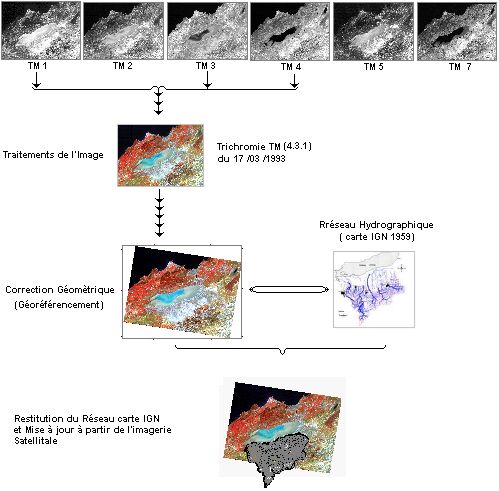
Fig n°3: the organization chart adopted for the update of the hydrographic canal
The combination of satellite and topographic data permitted us to determine four sub waterched, draining the set of the plain of Mleta (2). (Fig n°: 4)
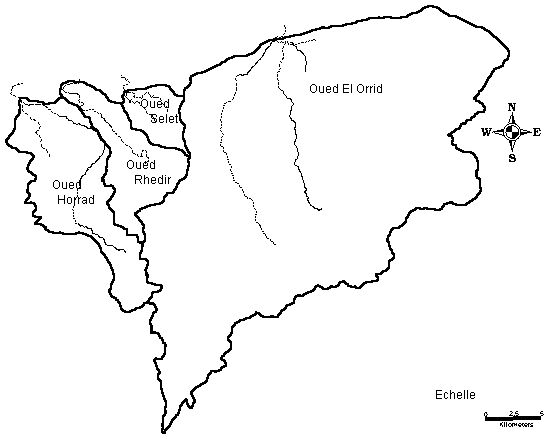
Fig n° 4: Mesh of the sub waterched the plain of the Mleta.
Because of the technic of digitalization, that consists in recording the topographic coordinates of the long-haired hydrographic with the help of a shelf to digitalize, we could reconstitute the set of the hydrographic network by concatenation of the different topographic depths covering the zone of study to the 1/50.000 (leaf of El Amria, Arbal, O. Imbert and Ain Temouchent).
The satellite pictures "standard " handed over to the users are not georeferenced with regard to such or such cartographic projection. The operation consists in correcting the satellitale picture geometrically while doing a transformation toward a projection of reference that will permit to localize the objects precisely on earth soil while endowing them with geographical coordinates. But it also permits to proceed to their orthorectification, or then to integrate them, to treat them or to visualize them in a SIG (or all other georeferenced data base).
For this we proceeded to the extraction of 45 bitter points by successive location in the picture and on the topographic chart to the 1/50.000, that was used as cartographic reference. Only 21 points have been kept. For our case, we used the function of interpolation of the nearest neighbor that consists in affecting to the point current of the corrected picture the radiometry of the nearest point in the raw picture.
In order to estimate the precision of the correction, we based our study on the residual errors analysis between the obtained and real values of the chart. In this case, the error was estimated to 0.89 (lower to a pixel), (total RMS ERROR = 0.890136).
The operation consists in digitalizing the network lachs observed in the mountainous zones and the plains and to draw the watershed borders while following the line of the sharings of waters. Eleven (11) sub watersheds have been delimited in the zone of study to which we affected the personalized codes (Fig. n°: 5).
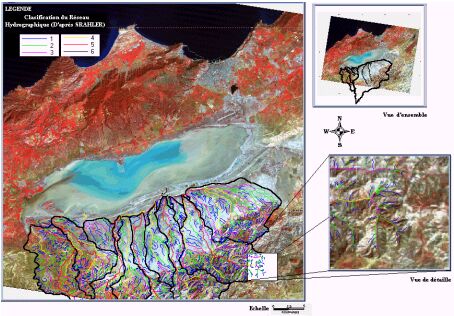
Face n 5: updating of the drainage network.
In the zones where following the hydrographic network becomes difficult a second picture of synthesis in three dimensions (3D) is elaborated in order to fly over the zone in question. This operation is achieved from a set of images under different angles. These pictures are the product of the superposition of the satellite picture on the Digital Model Elevation (DME) of the zone of stady. (Fig. n°: 6)
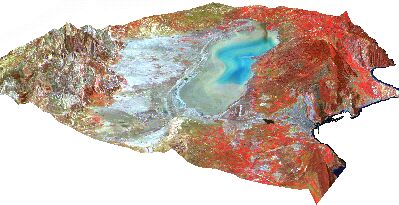
Fig n° 6 : Satellitale picture in three dimensions
The results archieved reveal that the satellitale imagery well georeferenced is by excellence the cartographic basis for the updating of the hydrographic network.
The repetitivity, the spatial and spectral wealth of the TM imagery can be considered in particular like an useful basis in the thematic chart production particularly for orographiques charts.
The combination of satellitales data with the Digital Model Elevation (DME) give better perceptions of the elements constituting the physical environment and open promising perspectives in the domain of the photo interpretation.
The high resolution imagery arrival like those provided by IKONOS satellite with a resolution of 4 meters and 1 meter can be used in the domain of big scale cartography, and more precisely in the updating of the hydrographic network.