Ing. Marketa Hanzlova
Planetek Italia s.r.l.
Via Massaua, 12
70123 Bari
E - mail: marketa@planetek.it
The conference contribution represents description of a stage program dedicated to demonstrate the use of Space Technologies for monitoring WH sites. The stage took place in Planetek Italia s.r.l., company that operate in the field of GIS and RS. As a student I participated to project SOGHA where the ESA was the client.
The stage focused on EO common processing techniques and on studying SAR imagery capabilities.
The habitat of the mountain gorillas is located in three different areas in the border region between Democratic Republic of Congo, Rwanda and Uganda, countries affected by regular conflicts and pressure from farming and refugees. For these reasons, and because the terrain is mountainous and of difficult access, Earth Observation (EO) techniques are particularly valuable.
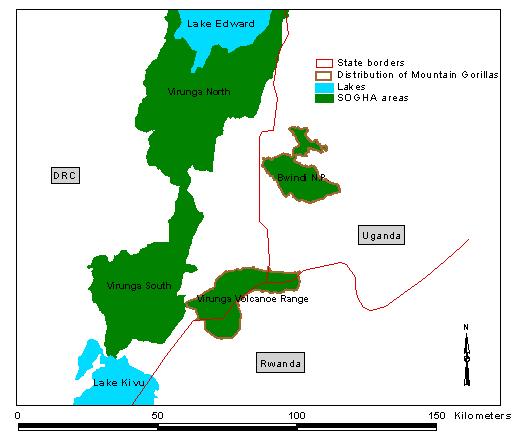
A case study area was defined in the 27th November 2001 meeting taken place in ESA/ESRIN. The area is showed below in Figure1 and consists of several protected areas in three different countries.
The area consists of the following sites:
The Parc National des Virunga (Democratic Republic of Congo) is the largest of the study areas and corresponds to only part of the National Park (all of it being a WHS). It extends from Lake Kivu, in the south, to Lake Edward, in the north. Its value resides not only in population of mountain gorillas (Gorilla Beringei Beringei) leaving in the volcanoes region and small population of eastern lowland gorillas (Gorilla Beringei Graueri) but also in very high level of biodiversity and endemicity.
The Bwindi Impenetrable National Park (Uganda) is home of mountain gorillas (Gorilla Beringei Beringei) and is also a WHS.
The Parc National des Volcans (Rwanda) is not classified as a WHS but is being nominated as a WHS by the Government of Rwanda. This park is currently a Biosphere Reserve.
The Mgahinga Gorilla National Park (Uganda) is the smallest component of the Virunga Volcanoes Range and is part of the habitat of mountain gorillas. It is contiguous to Parc National des Virunga and Parc National des Volcans. For this reason, and taking into account that the focal is the conservation of mountain gorillas, the area is treated as whole.
Figure 1 SOGHA areas are situated between two Great Lakes - Kivu on south, Edward on north.
The main objectives were EO data processing and integration these processed data with GIS data. GIS data are provided by ESA.
EO data pre-processing consisted from methodology as followed:
EO data processing consisted from methodology as followed:
GIS integration included as followed:
Lansat TM | 1987 | Bands: visible, NIR, MIR (1.55-1.75), Thermal, MIR (2.08-2.35) |
2000 | Bands: visible, NIR, MIR (1.55-1.75), Thermal, MIR (2.08-2.35) | |
Landsat ETM+ | 2001 | Bands: visible, NIR, MIR (1.55-1.75), Thermal1, Thermal2, MIR (2.08-2.35), Panchromatic (0.52-0.90) |
Table 1 Available optical data
Satellite ID | Product Type | Date |
ERS1 | PRI | 1994, |
ERS2 | PRI | 2000, 2002 |
Table 2 Available radar data
Data are provided by ESA ftp site. These data come from other participating partners in SOGHA project (e.g. IGCP, DFGF, ITFC). Data included vector layers in *.shp format. Some of the data were extracted from very old maps, hand draw maps, so in summary they are not very accurate and they should be updated according to EO acquisitions. Part of the data contains GPS measurements with high accuracy.
Optical images were atmospherically corrected. SAR ERS 1/2 images were associated with a spatial location (geocoded). All the data are projected in SUTM35 using WGS-84 datum. Optical Landsat data were georeferentiated to Aster image (provided on ESA ftp site) in GeoTiff format in fixed RGB composition. Aster image originates from University of Gent and is very well georeferentiated. Landsat ETM+ data were georeferentiated with the average RMS Error equal to 0.025. The panchromatic image were georeferentiated with the average RMS Error equal to 0.021.
Spatial enhancement procedures were done on SAR ERS1/2 images. A common average filter with 5 by 5 window kernel size was applied. Nevertheless several other filters (Frost, Lee, Weighting) were used and verified but the most satisfying one was the average filter.
Landsat images were stretched and clouds cover was masked using band 1 (blue) and band 6 (thermal) regarding assumption that the spectral respond of clouds in band one and six is divers. Clouds are colder then surroundings in thermal spectrum, contains little ice crystals and in visible spectrum they have very high reflectance, the wavelength is short; therefore in spectral range 0.45 - 0.52 (m they appear white and in spectral range 10.4 - 12.5 (m they appear dark. Thus the band 1 and 6 were divided. The result image was classified into clouds and non-clouds considering idea where higher DN values represent clouds.
The optical data capture the scene from years 1987, 2000, and 2001. Major part of the image from 2000 is covered with clouds, so we eliminated it from multitemporal analysis.
We appropriately combined Landsat bands considering the thematic information that ought to be extracted and analysed. The spectral composition of 1, 2, 3 bands (RGB) was used for detection of urban and infrastructure changes, spectral composition of 4, 5, 7 bands (RGB) was used for detection of vegetation changes.
We focused on vegetation border changes, urban expansions, and agricultural activity. During the 15 years we detected changes in Virunga Volcanoes Range border, in some regions were evident decrease of vegetation or in turn increase of vegetation, significant urban expansion, and new lava flows. In couple of cases we detected decreasing of agricultural activity but this is probably spawned by diverse acquisition date of compared images (1987 - summer, 2001 - spring).
SAR data span from year 1994 to year 2002. Unfortunately we didn't have image time series of the same scene so we couldn't create RGB temporal composition. Therefore we used SAR images for visual comparison with optical data, we are able to distinguish some vegetation types, and we can detect major roads and urbanism activity. For association optical and SAR data we need to correct terrain-induced distortion.
NDVI is less sensitive to atmospheric noise and more sensitive to bare soil noise. Our AOI is almost fully vegetated thus we generated NDVI and finally used it for patch analysis. NDVI values spans from -1 to 1 and the values above 0 represent vegetated areas.
This phase is divided into particular parts, which are described as follows:
SAR and vector data association: we attempted to georeferentiate ERS 1-2 images (ERS1-O16025_F7155_8AGO94, ERS2-O28446_F3627_28SET00) to Landsat TM image from 1987. Subsequent display of this data with vector layers was satisfying only for lowland areas. Nevertheless we are able to qualify deformation of above-mentioned images through the superimposition of park boundary vector layers.
Patch analysis: statistic information of vegetation patches were extracted from Landsat TM data, and performed as an example in customized presentation
Generation of DEM: contour lines provided by ESA on their FTP site served as a base for DEM creation.
Drape raster images over DEM: processed raster images were fused with DEMs.
Used software for this task - ArcView extension Patch Analyst - is spatial pattern analysis program for quantifying landscape structure. It provides a lot of instruments for spatial analysis and statistics of the analysed patches. With the Patch analyst capability there is possibility of multitemporal comparison of vegetation patches individually class patch by class patch. This methodology was used to analyse vegetation patches in the north part of Virunga Volcanoes Range to demonstrate an example of this methodology.
Thus after image pre-processing, we generated NDVI images for years 1987 and 2000 in ER Mapper 6.2. Images were saved in GeoTiFF format for following import to ArcView project. NDVI images were converted into ArcView GRID data model and classified into 6 vegetation classes according to NDVI values. Patch analyses were done on all the classes and then class with high vegetation density for years 1987 and 2000 was chosen and was done temporal comparison. There is also possibility of creation CORE AREA within vector/raster polygon that represent a patch.
The core area is the interior area of a landscape patch and is defined by a core area buffer distance. The example in Figure 2 shows two core areas from a grid file. This example grid consists of 122 pixels, each 25 meters by 25 meters. Choosing a core area buffer distance of 25 meters it were created two core areas. The minimum possible distance is based on pixel size.
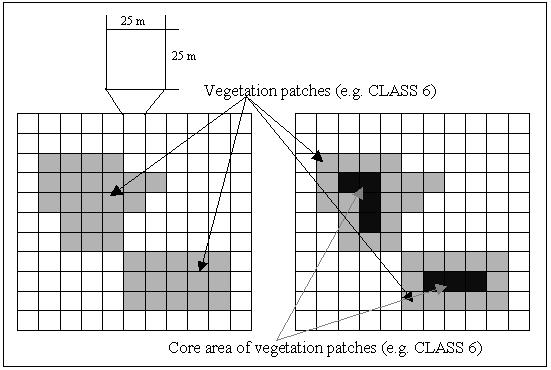
Figure 2 Core area demonstrations
Patch Analyst provides constituency of statistics as followed:
The statistics can be exported in MS Office Excel format, subsequently processed and visualized as graphs.
DEMs were retrieved from contour lines provided by ESA ftp site. Here the contour lines were stored in ArcView format *.shp. These data cover area of Bwindi, Virunga V. Range, and Mgahinga N.P.
Contour lines values represented by altitude were recalculated from feet to meters dimension values for Bwindi and Mgahinga areas.
Bwindi contour lines were improved for their values errors and connectivity bugs.
3D modelling was done with ArcView extension 3D Analyst. This extension provides surface analysis with GRID and TIN data models. GRID data also requires extension Spatial Analyst. Subsequently the GRID data were exported into ASCII XYZ grid file format and imported into ER Mapper 6.2 for followed image draping.
Drape methodology is based on layover DEM with EO data (in our case Landsat TM images).
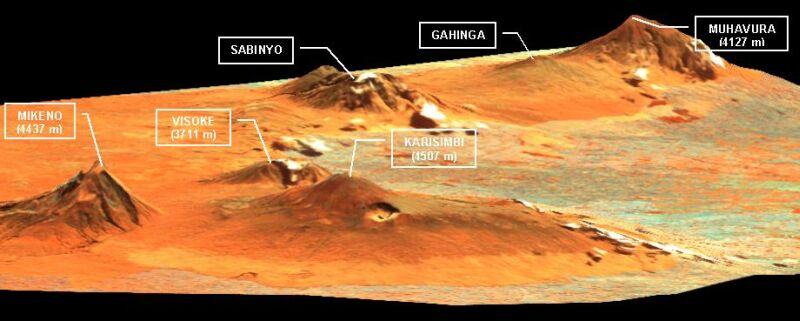
Figure 3 Image draping
Project was meant to facilitate the use of EO data for remote regions of difficult access, associate EO data with GIS data considering implementation of first "shared/common" version of GIS using WebGIS capability. This approach wasn't included in my stage program.
Project approaches lead to data centralization and project participants connection regarding to better WHS preservation.
Several new and common EO processing methodologies were established and were described in a final report.
The project contributes to elaboration of a graduation thesis of a student from University in Venice that is meant to enrich GIS and RS education (concretely Patch Analysis).
The vector data need to be corrected and updated according to EO data that are very well georeferentiated. Thus they will be more valuable then so far.
SOGHA will continue in Phase II and fulfil the gorilla preservation. Then SOGHA can serve as prototype for endangered species protection and preservation of World Heritage Sites.
RS | Remote Sensing |
WHS | World Heritage Sites |
ESA | European Space Agency |
IGCP | International Gorilla Conservation Programme |
DFGF | Dian Fossey Gorilla Fund |
ITFC | Institute of Tropical Forest Conservation |
NDVI | Normalized Difference Vegetation Index |
AOI | Area of interest |