N. Musaoglu, S. Kabdaşli, D.Z. Şeker, N. Elginöz, Ş. Kaya
Istanbul Technical University
Civil Engineering Faculty
80626 Ayazaga Istanbul Turkey
E - mail: nmusaoglu@ins.itu.edu.tr
Conflict Management is an opportunity for disagreeing parties to communicate and work out a solution that satisfies both disputants. In this study, Evrese coast of Turkey is selected as study area. This coast is one of the most important coastal areas because of having highly freak fish populations and covered with very fine sandy beach. This region is one of the main agricultural areas of the region. There is conflict between people who live this region because of coastal area usage. In this study, it is recommended and showed that using systematic monitoring systems, which supported Geographic Information System and Remote Sensing for different analysis using different kinds of data, will be the key of conflict management in the region.
The coastal zones have been the most sensitive part of the world because of their interface characters between the natural life and humanity. The relations and also interactions between the various components of nature and human activities are very complex. For this reasons the definition of sustainable development is also very difficult and may change from one coast to the other. Some coastal zones includes lots of natural properties together with the different human activities that may have opposite properties from environmental protection and sustainable developments points of view. There will be a conflict between the partners of coastal zone. In such cases a systematic, reliable and continuous monitoring programme is needed to design a management plan of coastal zone.
All countries with a coastline have an interest in the sustainable management of the coastal resource systems. The coast is a difficult place to manage, involving a dynamic natural system, which has been increasingly settled and pressurized by expanding socio-economic systems (Turner, 1999). Coastal management requires integration across geographic boundaries, time scales, sectors, political and institutional boundaries, disciplines, and across the policy, management, education and research arenas. The goal of coastal management is to improve the quality of human communities, which depend on coastal resources, while maintaining the biological diversity and productivity of coastal ecosystems.
Dictionary describes conflict as "a battle, contest of opposing forces, discord, antagonism existing between primitive desires and instincts and moral, religious, or ethical ideals." Conflict occurs when two or more people oppose one another because their needs, wants, goals or, values are different. Conflict management is the practice of identifying and handling conflict in a sensible, fair, and efficient manner. Developing and using skills such as effective communicating, problem solving, and negotiating with a focus on "interests" can manage conflict. Conflict management helps spend less time settling disputes among people and reduces tension among them and can only be done with positive models.
Information about change is necessary for updating land cover maps and the management of natural resources. Although ground measurements are more commonly used in determining the change, new methods, too, are being used in line with the fast technological developments. As in many fields, it is shown that the studies aimed at determining, monitoring and managing the changes in the coastal zones entail quick access to information, updating and storage of such data. In order to capture the time and space dynamics of the coastal environment, earth observation satellites have become a crucial component for coastal mapping and management. Earth observation satellites; offer frequent data acquisition, fast delivery schedules, and a range of imaging options.
Remote Sensing Technology provides a method for acquiring regular, current information about environment for monitoring these kinds of changes. Remote Sensing Technology, which has rapidly become popular, appears to be the most efficient method for thorough and rapid information gathering. Geographic information systems provide opportunities for creating more dynamic and meaningful analysis opportunities for creating more dynamic and meaningful analysis opportunities for potential users by integrating multiple layers by integrating multiple layers of spatial information. Multi-temporal remotely sensed images are important and effective data sources for monitoring the rapid changes of coastal land uses (Zhou et al, 2002). There are many studies to monitor shoreline changes, urban expansion and coastline changes by using multitemporal satellite images (Zhou et al, 2002, Donoghue et al, 2000, Nellis et al., 1998, Ridd et al, 1998, Chen et al., 1998, Li et al., 1998).
Tourism including summer housing is continuously being developing in this region. Main reason of this popularity is closeness of Istanbul, which is approximately, takes three hours. Istanbul is the largest and most crowded city of Turkey. In this study, a monitoring programme application has been done for a well protected coastal area where has been under pressures of different human activities by using remote sensing data and GIS. For this aim, 1992 and 1998 dated LANDSAT TM data, topographic maps and demographic data were used.
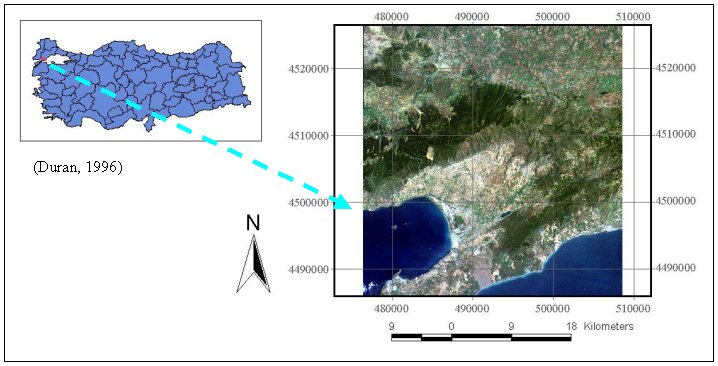
The Dardanelles connecting the Aegean Sea with the Marmara Sea is one of the major waterways of strategically and geopolitical importance. Greater part of study area is in the Kesan Township and rest of them is located in Gallipolis Township. Location of study area is given in Figure 1. Climatic elements of the region were assessed by putting into consideration the data provided by the meteorological stations of Tekirdag and Kesan from 1930 through 1985. Around average temperature value was 14.1 oC, average maximum temperature was 18.6 oC and average minimum temperature was 9.6 oC. Average rainfall in the Thrace region was between 550 to 1000 mm. being high enough for farming. In Figure 2 rainfall map of region can be seen. Flora in the region is forest and scrubs. Forests start in sea level and their density increase after 300 m altitude. As most of the rainfall in the region is in the form of heavy downpour there is superficial erosional activity caused by sudden rainfall in the slightly sloped hillside (Tozan, 1998, Kaya, 1999, Seker et al., 2000).
Area of Evrese Township is around 39 km2 and there is a clear decrease of the population in the year 1975 and 2000 (Figure 3).
Figure 1: Location of study area
Figure 2: Rainfall map of the study area
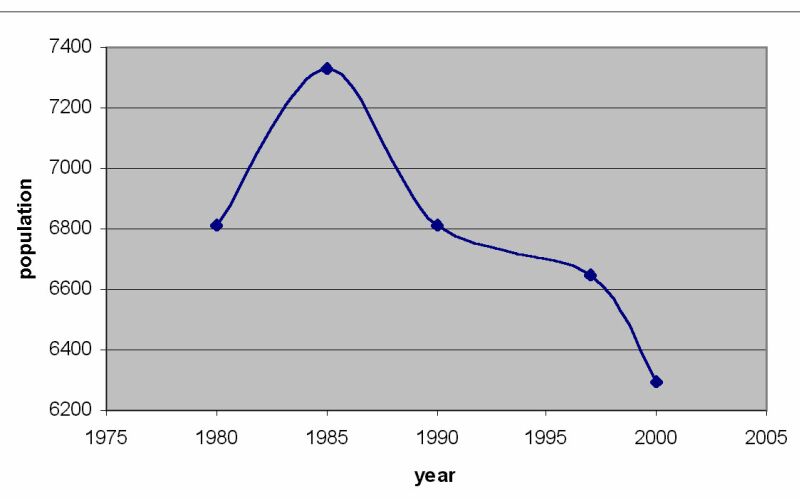
Figure 3: Population variations of Evreşe.
In Turkey, there are 15 major soil groups' categorized under five major soil zones. These major soil groups are further categorized according to three slope groups by the Ministry of Agriculture, Forest and Rural Affairs (---, 1987). In this study area four different soil types were determined. Soil map, which shows the different soil group of the study area, is given in the Figure 4. These four different soil types are:
Non Calcareous Brown Forest Soil (N2); developed on sand-clay stone, clayed and pebbled deposits under the influence of humid mild climate where annual precipitation is 500 - 750 mm.
Brown forest soil (M2); a soil type seen in the humid - mild climatic regions with dry seasons where annual average precipitation is 620 - 870 mm and developed on clay stones rich with limestone, micas and gneiss. This soil, which contains medium level of organic substance, has a clayed texture. As it has high water retention capacity, there is relative distinction in vegetation cover.
Non Calcareous Brown Soil (N3); developed on pebbled, sandy, clayed deposits and on calciferous sandy clay and sandy clay stones where the climate is semi-humid. Water retention capacity of the soil in sand texture is low and vegetation cover is grass and mixture of grass and shrubs.
Alluvial soil (AK); existing on young sediments brought and accumulated by rivers on the basis or the in the catchments area of surface waters, this type of soil is flat or almost flatly sloped, a zonal thin layered, well-drained.
One of the most important problems of this region is medium, severe and extreme water erosion because of excessive sloping land. This area is covered with mostly productive and large agricultural lands, pastures, forests and shrubs. Amount of rain is also included to this study as one of the layers of designed GIS.
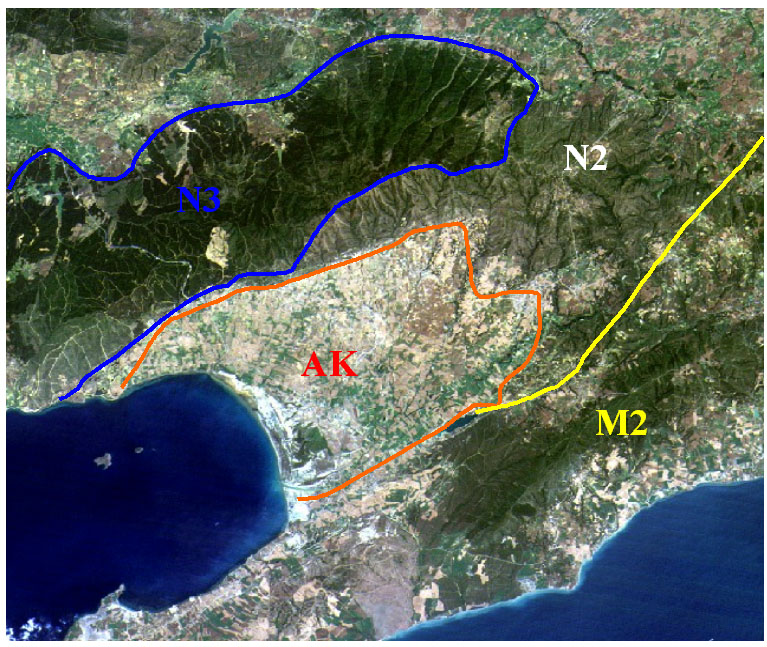
Figure 4: Soil map of the study area
In order to ensure geometric conversions of the satellite images, setting the shoreline and forming the digital terrain model, standard topographic maps of the area at 1/25000 scale have been used.
As the digital elevation models bear altitude information, they are used in obtaining resolutions, which cannot be obtained by two-dimensional analysis. By means of the interpolation methods applied to the altitude values which have been digitized from topographic maps, ground measurements, photogrammetry or remote sensing data and then transferred to computer media; brightness values at raster data at the desired pixel size and radiometric resolution can be obtained from the altitude values. Selection of the data sources, frequency of the points selected on the land and the mathematical method used in conversion are important for the quality and accuracy of the digital elevation model. Therefore, before the digital elevation model is formed, a method has to be established according to the purpose of the study and the desired accuracy (Musaoglu, 1999). In forming the digital terrain model of the study area curves have been digitized at each 20m from the topographic maps. 3D view of study area can be shown in Figure 5.
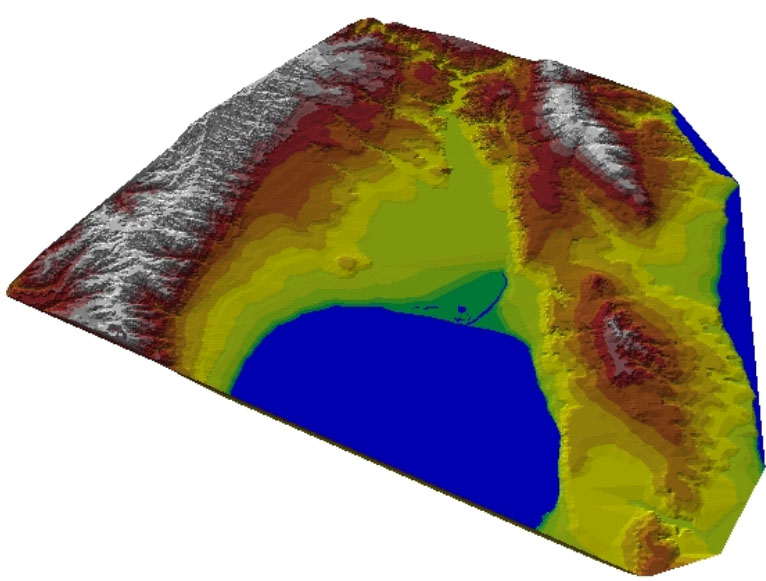
Figure 5. 3D view of the study area
In this research, multitemporal Landsat TM (1992, 1998) and SPOT Pan images have been used for analyzing of the study area (Figure 6). In order to provide the integration of all the data with one another, firstly geometric conversion was applied to the satellite images. Rectification was made to the satellite images by using 1/25000 scale map of the study area in digital media. The images were transformed into the UTM co-ordinate system by using 1st degree Affin transformation and 0.5 pixels RMS.
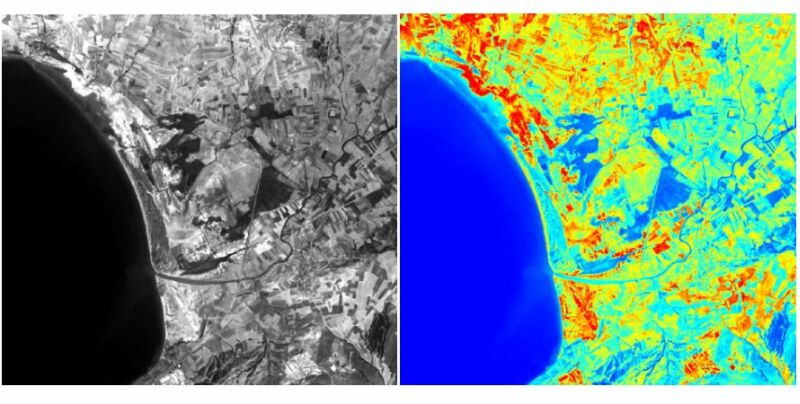
Figure 6. a) SPOT Pan in grey scale b) SPOT Pan in pseudo color
Different feature types in digital images constitute combinations, which contain different digital values depending on the natural spectral reflection and emission features. The aim of the classification is to group the objects carrying same spectral features. In classification stage, ISODATA unsupervised classification algorithm was performed on this data sets. Before the classification, preliminary information was required of the region in order to determine statistical limits. Various maps and photographs were used to select classes and ground truth studies have been done (Figure 7).
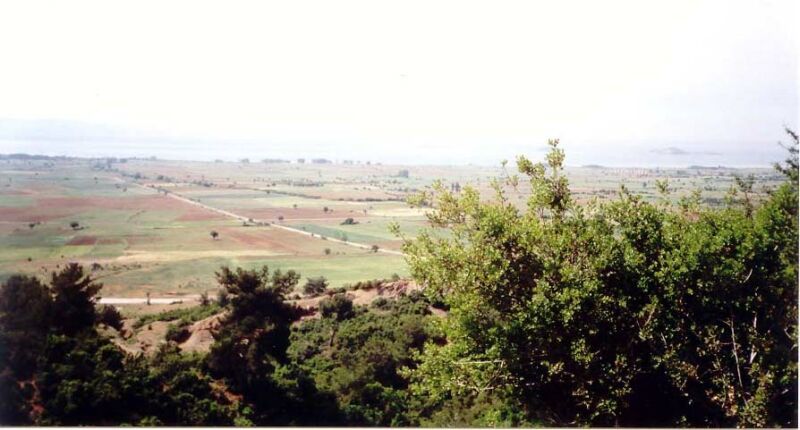
Figure 7. Photograph of study area
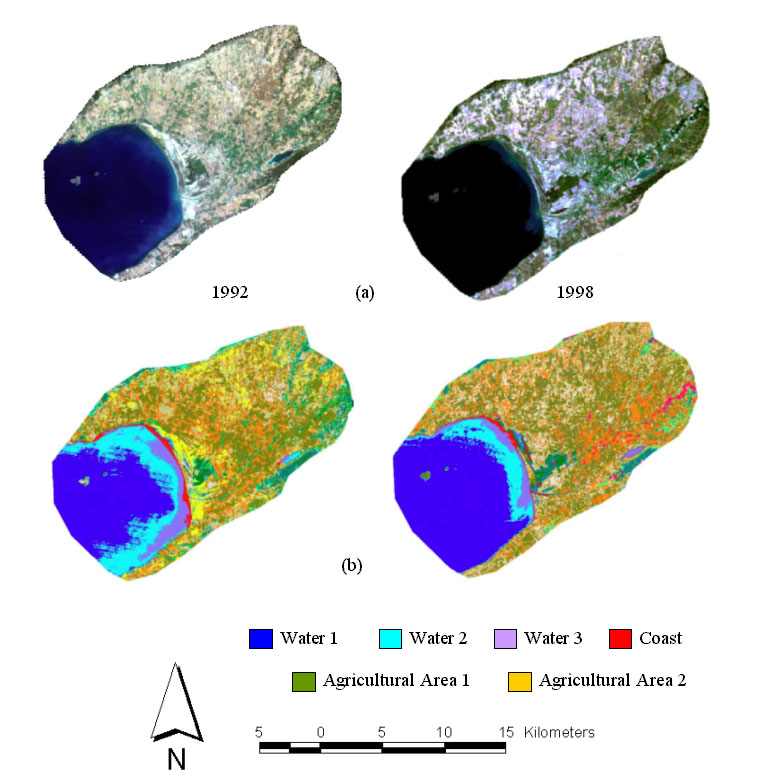
Figure 8: Evreşe plain a) Landsat TM images b) Classification results
Geographic Information System (GIS) is an automated system designed to capture, manage, analyse and output every kind of spatial data. Geographic information systems provide opportunities for creating more dynamic and meaningful analysis for potential users by integrating multiple of spatial information. GIS technology with remote sensing will provide maximum information content and analysis capabilities to the users. GIS are useful for the analyses of spatial and temporal biophysical parameters detected by remote sensing technique Narumalani et al., 1997).
In this study ArcView GIS was used for integrating and analyzing different type of data in a common system. In this study different data have been integrated and analyzed in the common system. Some of the raster layers such as satellite image and classified satellite image were added to the system. Rainfall map of Turkey, Soil map of Turkey, slope map and geomorphologic map were added to system as vector type data. Attributes data related to these coverages were also entered into system. Analyses have been done and produced map are used as a monitoring results to use solving conflicts.
Any of the coastal area might have a typical structure, which is available for different usage demand. Condition of the sustainable development on the coastal line is not only supplement of socio economic improvement but also protect of natural life components. Opposite characteristics of different activities must be removed and/or at least minimised.
If it is looked at the study area with a systematic monitoring method, there is one main water resource in the study area for irrigation of large agricultural areas. Slope of the plain is very low and all drainage connected to the same river. In the study area agricultural activities are very high and lots of different fertilisers is used. This is one of the main reasons of pollution in the water and threatens the natural balance of coastal line and lagoons located very close to the coastline. It is very difficult to determine coastal line in this region because of the low elevation range on the coastal zone. This causes lots of conflicts between different groups such as real estate developers and local people. For example according to the law build a building is forbidden certain distance from the coastal line. The coastal line always the subject of arguments. Because of the special bathymetric condition of the saros gulf, building coastal structures strictly prevent in this region. This will help protection of natural conditions of the coastal line and lagoons.
This area is becoming very popular as summer resorts and number of summerhouses is increasing. Because of these effects there is a different population movement in the area. While population of native residents of the area decreasing, summers season population increased rapidly. This increment in the population and their activities together with pollution badly affects water quality and morphological structures of the coastal line. Because of the relatively difference in the level of social economic conditions of these two different groups who live in the same region causes serious problems. To supply continuity of existing features in the study area is only possible limiting of tourism pressure. Conventional usage can be continuing together with control. Civil Public Organisations are also taking one of the main parts of argument. This argument between the different sides can only be solve with clear and understandable results of modern monitoring techniques such as GIS and remote sensing.
Even though the study area is relatively small, it is a problematic region. In the greater zones arguments will be increased and become more complex. In this respect, presence, reliability and success of monitoring program will be a key for the conflict management.
Decision making information needs, with information that is: timely, easily understandable, displayed clearly, of the right space and time scales. Information must be provided that is adequate and in time for action. The decision maker needs up to date maps most readily derived from aerospace on a great variety of themes that vary from region to region.