José Ramón Rodríguez Pérez, María Flor Álvarez Taboada
Area of Geodesy, Cartography and Photogrammetry Engineering
Mining Department
E.S.T.I. Agraria - University of León
Avd. Astorga s/n
24400 Ponferrada - León (Spain)
E - mail: dimjrp@unileon.es, dimmat@unileon.es
Advantages of using Geographic Information Systems for improving wine quality are set out in this paper. This tool let know with a high accuracy and store the spatial distribution of production and culture labours, which affect the quality of the obtained output. Two of the main tasks in a controlled wine-producing area (Denominación de origen), performance and production, can be monitored, and the management of natural resources can be improved, planning treatments with pesticides and harvesting in the optimum moment. As a practical case a GIS is designed for a vinery located in Canedo (Denominación de origen Bierzo). Finally guidelines for future developments are defined.
Viniculture, in all its facets, is considered as an art linked to a science. In Europe the vine is one of the classic crops and in countries like France, Italy and Spain, wines are considered excellent, thanks to the accumulated experience throughout the centuries. In other areas, as America or Australia, the vine production has been outstanding for only the last forty years and the wines are not high quality ones.
Because of this situation and to compete with the European expert vintners, the biggest American vine-producing companies tried to compensate the lack of experience with the application of the new technologies to their vineyards. The results of projects like GRAPES (Grapavine Remote-sensing Analysis of Phylloxera Early Stress), CRUSH (Canopy for Remote-sensing Uniformly Segmented Harvest) or VINTAGE (Viticultural for Integration of NASA Assessment ot the Grapevine Environment), showed that it is possible to know the soil, microclimate and vegetable material of the vine-producing zones in detail in only few years (Johnson et al., 2001b), in contrast to the centuries needed by the European experts to have a thorough knowledge of their vineyards.
The number of applications of the geoinformation tecnology to the vine management is increasing, specially if the grapevine growing is taken into account. Diverse current applications which aimed to become useful tools for vine growers and enologists are described in the bibliography (Carothers, 2000). The most used ones are focused in the identification and precise location of the production variations and stress levels, as well as in their correlation with the topographic variables. Another important application is seaching for areas with good aptitude for grapevine growing, since the quality of the wine is highly conditioned by soil properties (depth and soil kind, slope, aspect and altitude, fundamentally).
In the first experiences aerial photographies were used to generate cartography and to determine the grapevine vigour levels visually. The present applications are more interested in digital information than in photographies on paper. Digital maps of the vineyards are made, were different information levels or layers can be distinguish. Digital maps dealing with soil, irrigation systems, digital elevation models, stocks, productive varieties, soil nutrients, pests and diseases, multispectral images, etc., are combined, so that the vineyard can be visualized in an authentic virtual reality.
This information is usually integrated in a Geographic Information System (GIS), which allows a more effective management of it in a computerized enviromment. Complementing the queries to the GIS with field work, the vine grower can identify nutricional deficiencies or irrigation necessities, plan strategies for the labours, organize staggered harvests and many more possibilities. The employment of all this information repels in the obtained wine and the clearest example is the increase of the quality of American wines in the last years (Weier, 2000).
The term precise farming appears in the U.S.A. during the Nineties and it is developed fundamentally by the huge grain dealer industries. Its application was made possible by the appearance of the production monitoring systems for specific crops. This technology is supported by GIS, remote sensing, GPS, etc., and more specific applications for each crop are being developed.
Precise viniculture is based on the use of production and quality monitors, incorporated into mechanical harvesters. Vine production can be represented as a system, with its inputs (nutrients, water, etc.) and outputs (grapes and wine), monitored by the vine grower. Precise viniculture is focused on the modifiable variables in order to increase the efficiency of the process. In each area of the vineyard the necessary input should be added (fertilizers, pesticides, labouring, etc.) depending on the obtained or expected results (output). This process will be more efficient whichever better the entrances and exits are controlled and whichever better is the information (Bradley, 2000).
Therefore, the adoption of the precise farming implies a cyclical collection data system (using field observations and information from remote sensing and photogrammetry), interpretation and evaluation of the collected data (GIS) and implementation of the results in the labouring methods, to get the aimed goals (quality and quantity of grape and wine).
A key question for precise viniculture is to count on a good thematic cartography about vegetative state, harvest profit, soil type, etc. Protocols for getting maps of vine yield (Bramley and Williams, 2001), vegetative condition or vigour (Johnson et al., 2001a, Johnson et al., 2001b), etc. have been developed, and they have been linked to other environmental variables by means of tools like GIS (Bramley, 2001a, Smith, 1998).
New trends lead viniculture to a sustainable and respectful with the environment production, without it has to involve a decrease in the economical profit. It is at this point where precise viniculture should play an outstanding role, so that input is minimized, specially pesticides, fertilizers... The analysis and graphical representation (maps) of the spacially distributed variables (geoinformation), should be useful for the decision-making concerning where, how and when to act (Smith, 1998).
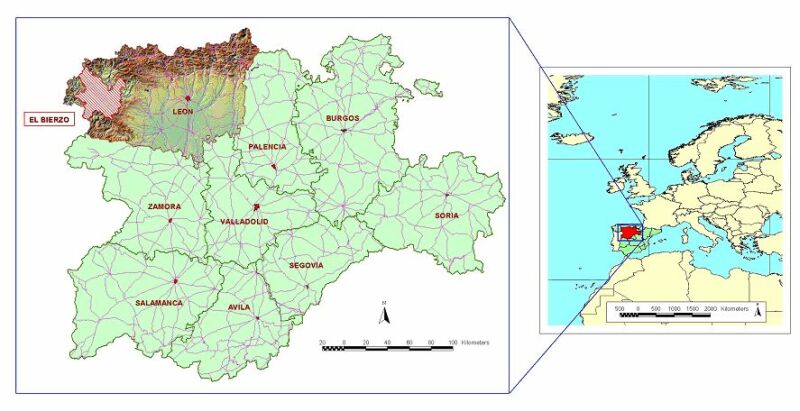
The study area is located in the village of Canedo (Arganza), belonged to the Comarca (Region) of El Bierzo (figure 1), situated in the Northwest of the province of León (Spain). With 2,954.28 Km2, El Bierzo represents the 18% of the provincial surface. The relief confers to El Bierzo a special microclimate with mild temperatures and regulated by certain humidity: the annual average temperature is 12.3o C, the average maximum is nearly 23.6o C and the average lowest temperature is about 3.6o C; the annual average precipitation is 720 mm; the annual average insolation has been estimated between 2,100 and 2,200 hours of sun.
Figure 1: Location of El Bierzo.
The wine of El Bierzo acquires in 1989 the level of quality wines produced in certain regions (V.C.P.R.D.), by means of the ORDEN of 11th of December of 1989 throught that the regulations of the Denominación de Origen "Bierzo" and its Regulating Cabinet (Consejo Regulador) are approved. The "Denominación de Origen", abbreviated to "D.O.", is a prestigious product classification which is awarded to some wines and food products that are produced in designated Spanish regions according to stringent production criteria. "D.O." labels serve as a guarantee of quality.
According to information obtained in the Regulating Cabinet, at 31-12-2000, the surface enrolled in the Registry of Vineyards is 3,853 ha and the number of registered vine growers ascends to 4,815, of whom 4,235 are associate to cooperatives or SAT (Transformation Agrarian Societies). Concerning productions, during last the ten years, these have varied between 7,000 and 37,000 tons, whereas the number of bottles sent to the market has been increasing permanently.
In this area, the plantation density in the vineyards varies between 3,000 to 4,000 vines/ha, according to varieties and municipalities, with an average production of 7,000 Kg/ha (Sanz, 1982). The average size of the parcels is 0.132 ha/parcel (Mapa, 1999), and this small value is one of the most important problems for the vine production and it conditions its management. The authorized red grape varieties are Mencía (mainly) and Garnacha Tintorera. The main white grape varieties are Dona Blanca and Godello, although also the Malvasía and Palomino are recognized.
As mentioned before, the study area is in Canedo, village belonged to the municipality of Arganza (Figure 2).
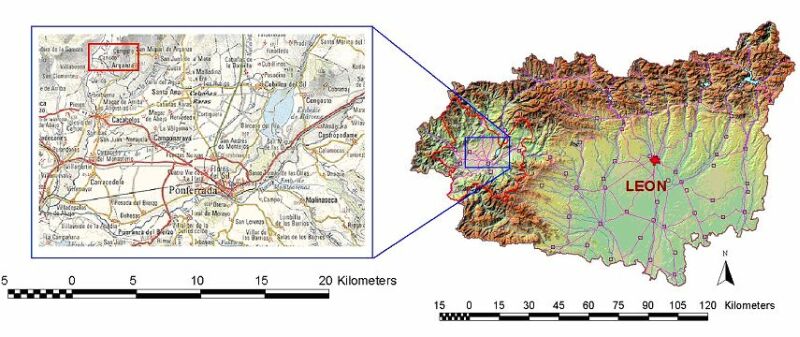
Figure 2: Situation of Canedo
The plots included in the study are settled in the vineyards of the company Prada a Tope S.A.. This company started to elaborate wines in 1976 using grape from other vine growers. In 1988 they got involved ina a great project, buying fields and the Palace of the Senorío of Canedo, in order to plant vines there, to construct a new warehouse and to take advantage of the warehouse of the own Palace for the aging of vintage and reserve wines. The current aspect of the facilities is in figure 3.
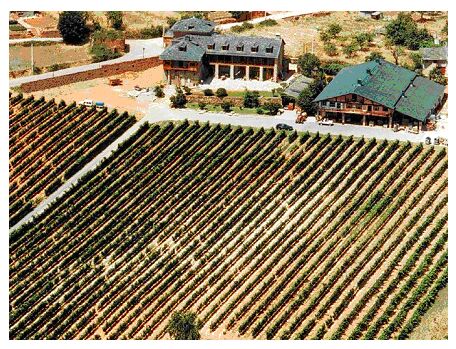
Figure 3: Vineyards, vinery and Palacio of Canedo
But the most exceptional point is that this company has its own vineyards, where chemical agents are not used (weed-killers, chemical fertilizers, insecticides and systemic fungicides, etc), with exception of the traditional ones (sulfur, copper sulphate). The average altitude of the vineyards is 650 m, on South aspect slopes to take advantage of the greater insolation.
The wine elaboration is based on the kindness and peculiarity of the raw material, so that the vineyard management and monitoring is one of the most important points to take into consideration.
The wide variety of elaborated wines is shown in table 1, which points out the neccessity of implementing the yield in a GIS to optimize it, even the productive area is not very extensive.
Wine kind | Grape Variety |
Blanco Chardonnay | Chardonay 100 %. |
Blanco | Godello 90 % |
Rosado | Mencía 70 % y Godello 30 % |
Tinto Crianza | Mencía 100 %. |
Tintos | Mencía 100 %. |
Tinto Maceración | Mencía 100 %. |
Tintos Reserva | Mencía 90 %. |
Xamprada reserva brut nature | Chardonay 80%, Godello 20% |
Xamprada vino espumoso Brut | Chardonay 80%, Godello 20% |
Table 1: Wine kinds produced in El Palacio de Canedo
The main aim is to develop a GIS proyect in the vineyards of the Palace of Canedo, to be used as a useful tool to generate tematic cartography for the vineyards (phyisiographic information and information for management).
The second objective is establishing different management blocks, based on the information stored in the tematic database, so that a specific management program could be fitted for each of them.
The third objective deals with this last topic: a spacial an tematic analysis of each block is required, to integrate its results in the labours and harvest plannig.
The determination of new suitable variables to be included in the GIS and the next steps to improve the basic GIS is the last of the proposed objectives.
The first phase of this work defines GIS model to implement (Figure 4), estabilishing such important questions as the scale of the cartography and the information to include in the database.
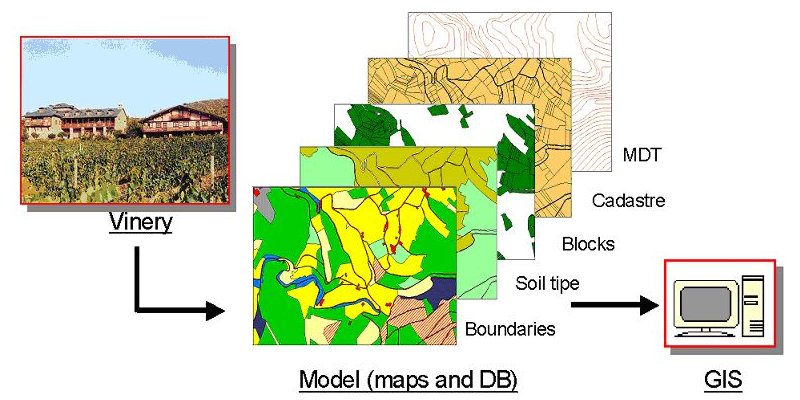
Figure 4: GIS model
Next figure shows the information that is considered basic to be introduced in the database, taking into account the needs of the vinery. Not only data, but also the proposed structure for the database are in Figure 5.
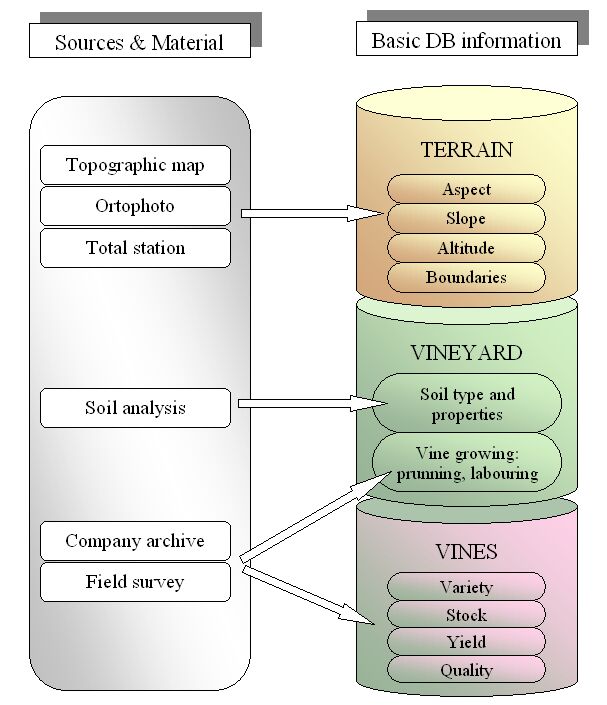
Figure 5: Sources, material and basic information in the Data Base
Information about physiography and boundaries (TERRAIN data) is collected at different scales. A topographic map escale 1:10,000, UTM projection, contour lines each 10 m for the study area (Northwest limit: 29T 688143 4724846, Southeast limit: 29T 688930 4723944), is used for locating grosso modo the area, and as a first approach. To complete this information and as a source for tematic information an colour orthophoto (escale 1:10,000, pixel size: 0.7 m) is employed. Accurated topographic cartography (slope, aspect, altitude, digital terrain model (DTM), boundaries) is generated from the data collected by the electronic total station TOPCON (Model GTS-212). Resolution is a main question in viniculture cartography: if the study deals with individual vines a resolution of 1-2 m is required, and if a block is going to be the unit, 4 m resolution is enough (Carothers, 2000). As long as this is a pioneer work in this area, a 4 m resolution cartography has been considered suitable as a first approach, even though it could be increased in future updates.
Data about soil types in the vineyards and their properties is provided by the company, and they consist on soil analysis made in february 2001, where texture, chemical composition, capacity for cationic interchange and conductivity were analysed. Characteristics of the vegetal material (vines) are set from the company archives and verified by field surveying; the inventored variables are variety, stock, yield and quality.
After developing the basic database, provisional blocks of vineyards are defined, regarding physiography and varieties. Each block should be as homogeneus as possible, trying to achieve a low number of blocks, because this is a preliminary classification, which would be used as a base for the following and more precise ones. Once the blocks are set, tematic information from the database is associated to each of them and cartography is generated (slope, aspect, DTM). Slope, aspect and soils are analysed in order to established a raw clasification of the blocks which allows to make some proposals for their management.
The results of the analysis are used to determine which new variables should be included in the database.
Once the GIS structure is defined the undertaken advances in the proyect are displayed. The grafic and alphanumeric database is partially defined, and as a first result the accurate representation of the property boundaries is presented. The vineyards have been delimited carefully, due to their importance for the next stages of the project (figure 6).
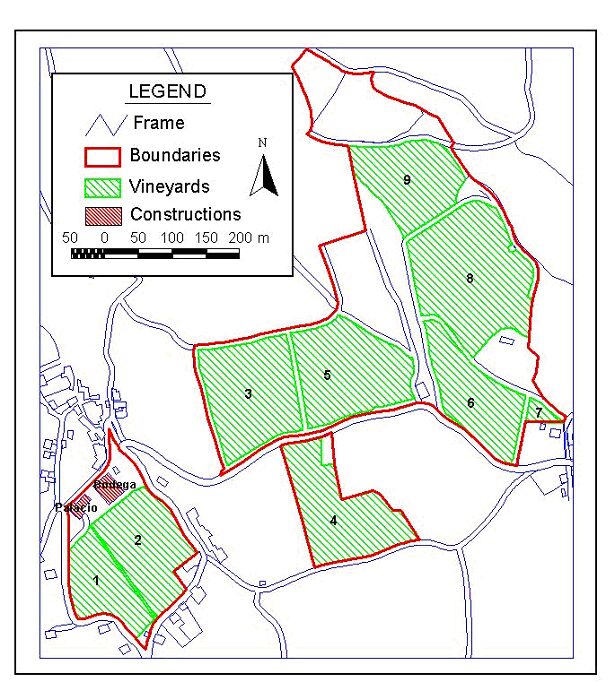
Figure 6: Boundaries of the study area (Palace of Canedo vinery) and of the vineyard
The preliminary blocks delimitation was done and they have been characterized through the database information. Nine blocks have been delimited and identified in figure 6, with numbers from 1 to 9. The main characters are displayed in Table 2, as a result of quering the basic database, such as the area, the planting year, the number of vines and the most representative variety.
Block | Name | Area (m2) | Year | No. vines | Variety |
1 | Palacio | 10521 | 1987 | 2178 | Godello |
2 | Bodega | 15618 | 1987 | 3366 | Chardonay |
3 | El Valetín | 19792 | 1990 | 4810 | Cabernet Savignon, Mencía |
4 | La Nueva | 18557 | 1997 | 4815 | Mencia |
5 | San Martín | 20128 | 1989 | 4743 | Godello |
6 | Campelo | 14256 | 1987 | 3220 | Godello |
7 | El Palomar | 1008 | 1980 | 450 | Palomino |
8 | El Depósito | 28016 | 2000 | 7550 | Cabernet Savignon, Merlot, Tempranillo |
9 | El Regueiral | 15184 | 1990 | 2777 | Godello |
Table 2: Provisional blocks definition
The results of the chemical soil analysis are presented by block in Table 3, to describe each of them and determine the possible needs. The low fertility level is the most outstanding result, as a low content of organical material, but these are expected properties in soils in vineyards in El Bierzo.
Block | Texture | pH | O. M. (%) | N (%) | C/N | P. (ppm) | C.I.C. (meq/100g) | Conduct.(dS/m) |
1 | Loam | 6 | 1.51 | 0.09 | 9.25 | 23.00 | 6.00 | 0.08 |
2 | Loam | 5.7 | 1.70 | 0.11 | 8.65 | 10.80 | 5.80 | 0.09 |
3 | Loam | 5.5 | 1.65 | 0.13 | 7.4 | 29.80 | 6.70 | 0.10 |
4 | Loam | 5.5 | 1.20 | 0.08 | 8.75 | 10.10 | 4.95 | 0.04 |
5 | Loam | 4.9 | 1.15 | 0.07 | 8.60 | 5.75 | 2.75 | 0.07 |
6 | Loam-clay | 6.0 | 1.40 | 0.09 | 8.80 | 15.00 | 5.60 | 0.06 |
8 | Loam-clay | 4.9 | 1.8 | 0.30 | 8.10 | 33.40 | 5.05 | 0.09 |
9 | Loam | 5.0 | 1.80 | 0.09 | 11.10 | 8.20 | 2.30 | 0.11 |
Table 3: Results of soil analysis
The next maps show the slope (Figure 7) and aspect (Figure 8) of the vineyards in some of the provisional blocks stablished. In both maps resolution is 4 m.
Quantification of the previous maps is displayed in tables 4 and 5. Data point out that slopes are smooth enough to let mechanization, although in blocks number 8 and 9 the erosion risk is high. The aspect in all the vineyards is very suitable for grape ripen and it favours grape quality.
(o C) | 5 San Martín | 6 Campelo | 7 Palomar | 8 Depósito | 9 Regueiral | Total | ||||||
m2 | % | m2 | % | m2 | % | m2 | % | m2 | % | m2 | % | |
0-5 | 704 | 3.5 | 4448 | 31.2 | 256 | 25.4 | 320 | 25.4 | 128 | 0.9 | 5856 | 7.5 |
5-20 | 18256 | 90.7 | 9808 | 68.8 | 752 | 74.6 | 24224 | 86.5 | 10032 | 66.0 | 63072 | 80.1 |
20-30 | 1168 | 5.8 | - | - | - | - | 3472 | 12.4 | 4960 | 32.7 | 9600 | 12.3 |
>30 | - | - | - | - | - | - | - | - | 64 | 0.4 | 64 | 0.1 |
Total | 20128 | 100 | 14256 | 100 | 1008 | 100 | 28016 | 124.3 | 15184 | 100 | 78592 | 100 |
Table 4: Slope blocks 5-9
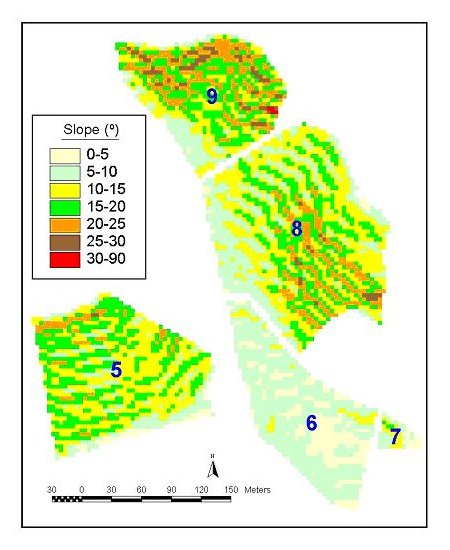
Figure 7 Slope blocks 5 -9
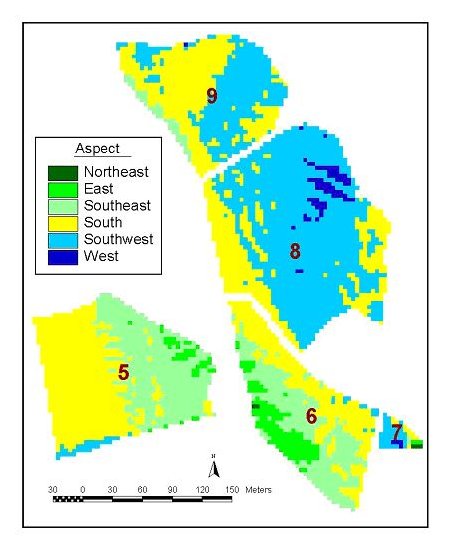
Figure 8 Aspect blocks 5-9
| 5 San Martín | 6 Campelo | 7 Palomar | 8 Depósito | 9 Regueiral | Total | ||||||
m2 | % | m2 | % | m2 | % | m2 | % | m2 | % | m2 | % | |
Northeast | - | - | 32 | 0.3 | 48 | 4.8 | - | - | - | - | 80 | 0.1 |
East | 720 | 3.6 | 2288 | 16.0 | 48 | 4.8 | - | - | - | - | 3056 | 3.9 |
Southeast | 8400 | 41.7 | 6304 | 44.2 | 32 | 3.2 | - | - | 816 | 5.4 | 15552 | 19.8 |
South | 10496 | 52.2 | 5424 | 38.0 | 176 | 17.5 | 6896 | 24.6 | 7696 | 50.7 | 30688 | 39 |
Southwest | 512 | 2.5 | 208 | 1.5 | 640 | 63.5 | 20016 | 71.5 | 6656 | 43.8 | 28032 | 35.7 |
West | 0 | - | - | - | 64 | 6.2 | 1104 | 3.9 | 16 | 0.1 | 1184 | 1.5 |
Total | 20128 | 100 | 14256 | 100 | 1008 | 100 | 28016 | 100 | 15184 | 100 | 78592 | 100 |
Table 5: Aspect blocks 5-9
Finally a Terrain Digital Model (TDM) was generated, and associated to a orthophoto, let visualize a block diagram of the vineyards and the facilities of the vinery (Figure 9). This overlay is possible due to the graphic part of the database and to the visualization tools included in the GIS software, and it is presented as an accurate approach to the real appearance.
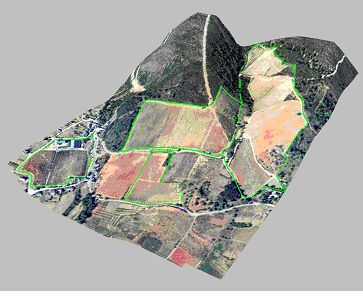
Figure 9: Terrain digital model and orthophoto: powerful output for visualization
As a result of the analysed information an approach to complete the database and the GIS is presented below. The resultant system would be focused in establishing different site index based on physiography and soil types, that would be checked with actual yield data. This site index would be taken into account when developing recommendations for management. A basic diagram with the variables to be included is shown in Figure 10.
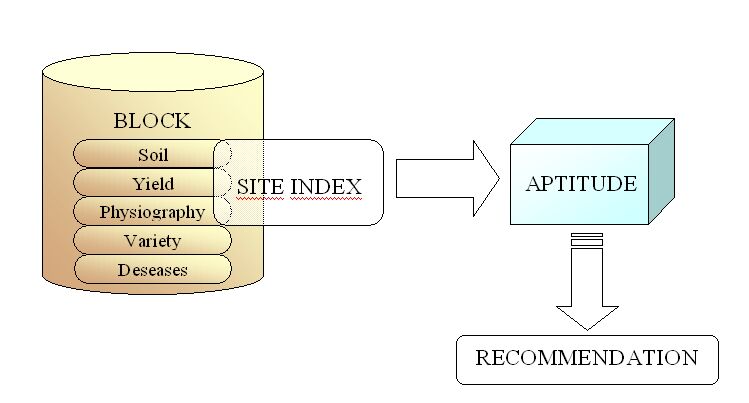
Figure 10: Diagram with the new variables to include in the GIS and further stages
Implementing a GIS in the vinery contributes to optimize the wine production, through the vineyard inventory and monitoring. The designed GIS (geoinformation and attribute data) allows to know, when finished, the spacial distribution of the yield and set relations with physiographic parameters. It will let plan activities, such as treatments against weeds and pests, or program the harvest to reach the optimum for each kind of wine. Efficiency and yields can be monitored, which is a basic principle for a vinery belonged to a Denominación de Origen.
Temporal evolution of production can be also studied, and vineyards can be zoned taking into account yield, varieties... Depending on how much information is avaliable in the database this zoning can be more accurate and more useful for management. In this work has been proved that new variables are needed to offer a more complete management program. These variables should be included so that performance could be calculated not only for each vineyard, but also for each vine and area.
Physiographic and yield information should be combined to determine which areas are more suitable to establish new vineyards, and also to detect which are not very profitable. The developed experience in Canedo is becoming a reference for other vineries, although until the cartography and the database would be not complete, the system will not display completely their capabilities.
As a further phase it is proposed to investigate the utility of high-resolution remote sensing as a means of directing timely in-field sampling to ascertain causes of detected variability in soil properties (pre-establishment) and vine vigour (pests, diseases, available moisture).