Joanna Bac-Bronowicz
Agricultural University of Wroclaw,
Department of Geodesy and Photogrammetry
ul. Grunwaldzka 53, 50-357 Wroclaw, Poland
Association of Polish Cartographers
bac-bronowicz@kgf.ar.wroc.pl
Marek Cieśliński
4net.pl
54-609 Wrocław, Godlewskiego 7/20
http://www.4net.pl, info@4net.pl
This paper presents a method of increasing a reliability of information obtained from the usage of the models of parameters' distribution, which describe the environment. The first step in modelling geospatial data is preparing full historical data base with metadata about position, time and natural conditions in neighbourhood of monitoring stations.
In this paper I would like to propose the way to provide easy access to information about present and historical data in stations measuring precipitation in Lower Silesia Region in Poland.
Proposed ways of visualization of information with multi-circle symbols may play a role in navigation in all disseminate precipitation data in Lower Silesia Region. It is constructed as multidimensional display in the static maps and in a map in Internet..Space as well as data measurement are shown in Internet's maps in interactive way.
The precise determination of zones, for which the value of natural parameters has been established with high probability, is of great importance particularly in interdisciplinary research where specialists from different scientific fields cooperate very closely.
Key words: point data, visualization of point data, static maps, maps in internet, reliability of information, precipitation, geographic information system
Density of data points sufficient for creating continuous model with determined accuracy representing feature's distribution should be created basing on the existing data bank which is available for GIS users. My paper represents an approach to more suitable modelling of continuous features for climatic data. The method has been presented using as an example the collection of characteristics connected with precipitation.
This example has been chosen because the reliability of the parameters depends on taking into consideration suitably long periods of observation. It can be used when the present numbers of monitored points and their distribution are not sufficient but when we have historical, non-continuous up to date data (above 400 measurement points). Although many stations do not exist nowadays, it is possible to divide monitored territory into micro regions. Subdivision is possible due to historical data bank. Presently in Lower Silesia Region there are about 50 monitoring stations left (average - 1 station for 100 km sq.)
Accessible precipitation data are the result of measurements in monitored stations. Each of the meteorological stations provides information about the date of every registered feature. Localisation of each station is also known.
The first step in modelling geospatial climatic data is preparing full historical database with metadata about position, time and natural conditions in the neighbourhood of monitoring stations. Metadata is essential in further work on elaborating the distribution of parameters' values outside the measurement's territory.
In this paper I would like to propose the way to provide easy access to information about present and historical data in stations measuring precipitation. It is important to compare all the data presented on maps in order to discover historical trends. Particular attention has been paid to the way of visualisation of database. Elaboration deals with visualisation of time and space both in the static and Internet maps using complex signs.
Among many characteristics, data that are important for agriculture and broadly treated protection of natural environment and balanced development have been taken into consideration.
In 1891 the regular measurements of precipitation in Lower Silesia Region (south-western Poland) began. From 1889 till 1981 there were over 400 monitoring sites of gathering data. Data from this period are available in the Institute of Meteorology and Water Management and in the yearbook by Wiszniewski (Wiszniewski, 1953; data from pre-war period).
Each of the meteorological stations provides information about the date of every registered feature as well as its occurrence. This information is noted in metafiles.
For a certain number of stations in Lower Silesia the results from 110- year- long precipitation series concerning years from 1891 to 2001 are available. Average values of precipitation from 30- year- long periods (for example: 1931-60, 1951-80) are placed in particular series of 110 -year- long. But even a 30 -year -long period can be not representative because of uneven distribution of precipitation in longer perspective (for all 110-year period). Reliable maps, which show distribution of climate factors, can be created only basing on the results from the same periods.
This study proposes a selection of precipitation data series received from a measurement net:
On 3D representation, the time is presented on the z-axes with 110 classes characterized by temporal rather than spatial factors. Point data represent the location of each station. Point symbols represent many important features. After many trials of comparison the multi-circle complex symbols were proposed. Signs were constructed as hierarchy and succession system of circles showing the consecutive periods of observations. Circle symbols have been chosen because of very small area being in disposal (Kraak M-J., Brown A., 2001).
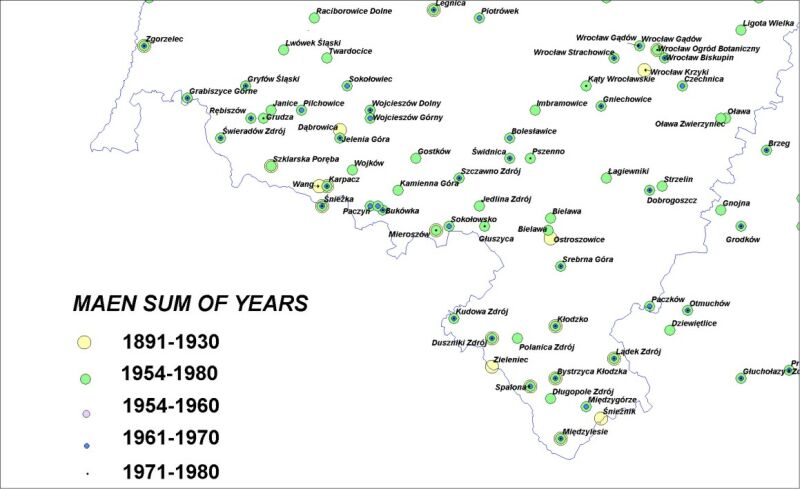
On static maps two solutions are proposed. The first one is combining signs to obtain information about measurements in different observation periods. The second one is intensity of signs' filling in separate observation courses in order to inform about complete set of data in each measurement period. It often happened that observations in meteo stations were discontinued for many years because of different reasons. In static maps complex signs represent total period of measurements of chosen characteristic (Fig. 1.). Events with this combination of characteristics are clustered temporally (several locations with similar attributes during the same year). On proposed visualisation, 7 kinds of maps with 7 variables of information about precipitation are shown.
Proposed maps with multi-circle symbols may play a role in navigation in all disseminate precipitation data in Lower Silesia Region. It is constructed as multidimensional display. Each of characteristics has to be treated separately because the set of characteristics is not always constant during the whole period of station's activity.
Fig.1 Complex sign represents data related to different climatic periods. Exterior circle represent pre-war period. The topographic basis (4)
To show continuous data, the graphic variable "colour" has been used. The complete data in each of the presented measurement's periods are the basis for further geoview construction. Variable "colour" to smoothly graduated tints have been indicated (Fig.2). The Fig. 2 presents developed form of proposal over the part of studied territory. It can be noticed that adding the variable "colour" might influence on improving the reliability of the system.
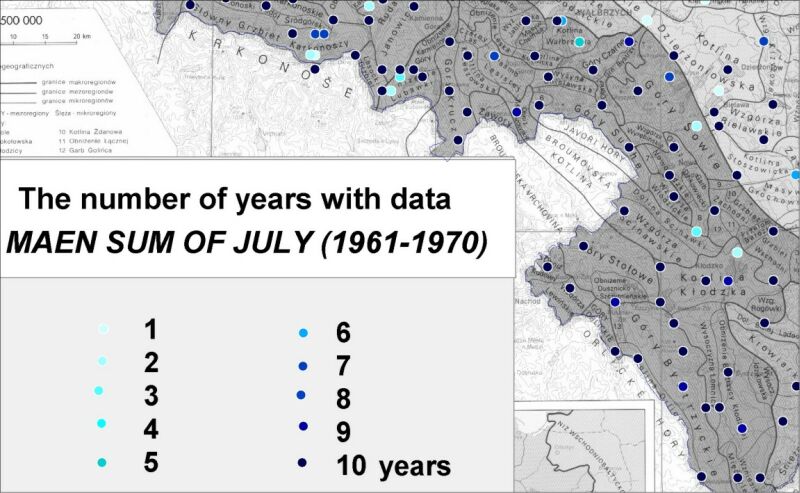
Fig.2 The complete measurements during the period of ten years (background Atlas of Lower and Opole Silesia, 1997)
The example presented in the paper is a simplified form of the more detailed proposal. All characteristics have been elaborated and many may be used in practical case of different thematic studies, planning and valorization. It is easier to compare maps that are created using GIS.
Planning those maps in Internet as the form of dynamic maps may occur very comfortable. I would like to show you a presentation of dynamic map prepared to be shown in Internet. If you would like to see my maps ("Flash Map Alpha"), please visit my homepage: www.geo.ar.wroc.pl/gislab.
"Flash Map Alpha" is an application based on Macromedia Flash, which displays variety of information about points on a map. All information about points, their location, name, geographical latitude, longitude, altitude and all other information are stored in data sources and generated in the graphical format during display (there are no constant points, everything is calculated on the basis of input data).Reference map related to dynamic scenes of the map is a common bitmap in jpg format in appropriate scale. Because of that, "Flash Map Alpha" can be adjusted to display information about any region.
The only limits are: the amount of information about single point and presented period. Application uses two different data sources: XML files and database (MySql).
First version of this project uses XML files as the sources of information about meteorological measurements in Lower Silesia during XX century. Each measurement is stored in a separate file, regarded to a single year. Meteorological stations are numbered and these data and other information about station are stored in single XML file. All calculations are executed in Macromedia Flash script, which displays the map. This is the main weak point of this version. The reason for that is a low calculations' power of ActionScript (Macriomedia Flash scripting language).
The second version of "Flash Map Alpha", which is actually under development, will be broaden and will include a possibility of presenting the average values in selected periods. To eliminate the problem of calculation's speed, every calculation will be realized by environment faster then Macromedia Action Script and information about points will be sent to graphical interface, which is still an implement of Macromedia Flash. The format of data storing will be also different. We are planning to use MySql database since this format allows to realize the wide scope of data operations such as import and export to many popular formats (Ms Excel, DBF, CSV). In this version problem with limited number of years, that will be presented has been also eliminated.
The selection of work environment for this application seems to be a very important aspect of the 2nd version of "Flash Map Alpha". All applications needed to run this system (Apache, PHP, Tomcat, MySQL), are based on GPL or other licenses and are free to use. Only commercial software used to build this application is Macromedia Flash (MX) but a user doesn't need to buy any software to run his own project based on our system.
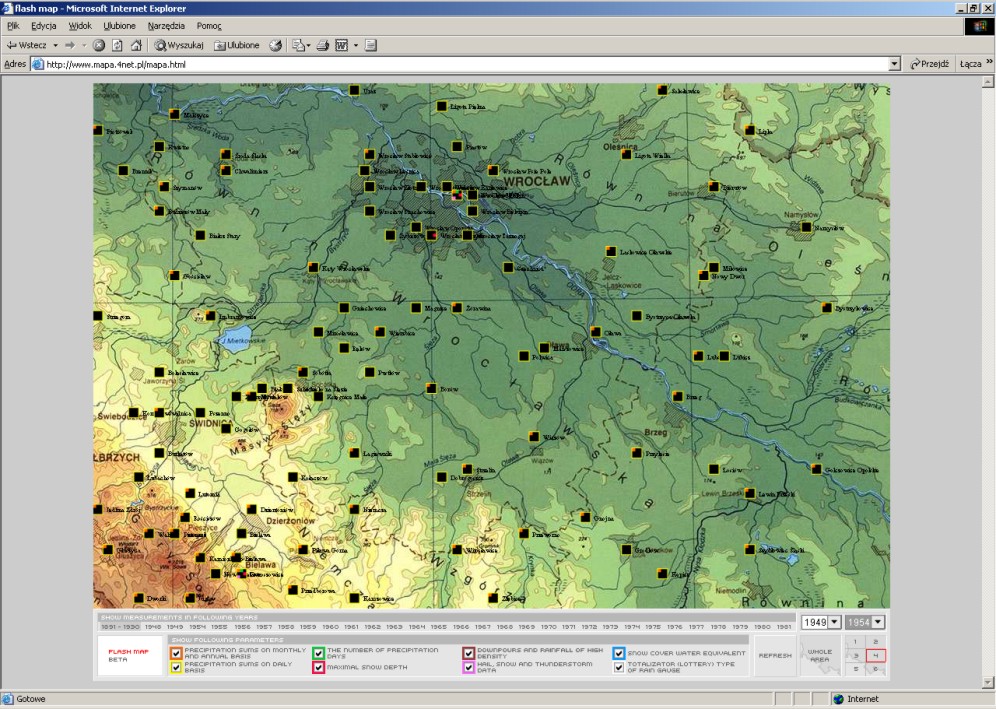
Fig. 3. Interactive display in dynamic presentation (background Atlas of Lower and Opole Silesia, 1997) (click on image to see it in original resolution)
The construction of precipitation model on the basis of historical data may increase reliability of information. This conclusion seems to be pertinent especially when we interpolate model from the existing data, using linear interpolation between distanced monitored stations.
Applied graphical variables: value, shape, pattern - allow to recognize holistic spatial distribution of chosen group of terminal data and assess the level of their reliability in studied part of Lower Silesia region.
When a station does not exist, there is a need to put some information about the determined probability of the climatic conditions analogy - which denotes in what way the next unit would be similar and whether the information could be removed. It would be a kind of meteorological uniformitarianism - the theory that meteorological phenomenon may be explained as a result of existing forces operating in the past.
This study proposes a choice of collection of climatic basic information obtained from survey stations and its further analysis dependent on distribution (Lee, Pielke, Kittle, Weaver, 1993), (Bac-Bronowicz, 2001).
The proposal of dividing the area around the station into the regions of homogenous climatic conditions containing the same type of information is the next step towards adding information about the distribution of phenomenon considered to be constant and distinguished on the basis of punctual measurements ( Fig. 4). Such a solution will be testes along with developing a Lower Silesia Spatial Information System in Department of Geodesy and Cartography of the Office of the Marshal of Lower Silesian Voivodship. Incidence of ground-frosts, hails, torrential rains and floods should also be analysed. Each region consists of elementary fields of climatic groundwork, which will be assigned to determine the type of climatic conditions with certain degree of climatic risk.
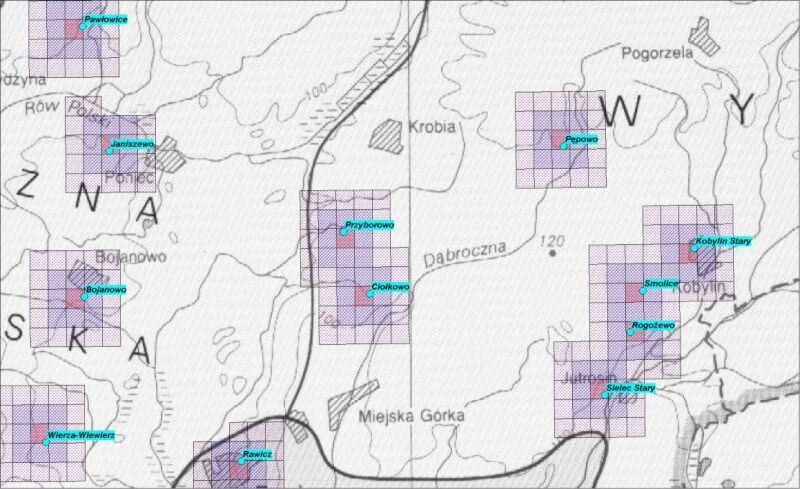
Fig.4. Assigning punctual information about adequate attributes to elementary fields in spatial information groundwork.
Sometimes it is not possible to transfer information from some places because there are different natural conditions or different time of observation than in the places from the nearest neighbourhoods. It seems that it would be better to leave some areas as terra incognita than to create false model of monitored phenomenon. These places are presently characterised with lack of data.
Basing on the available meteorological data, spatial distribution models of climate's characteristics were created, connected in various ways, and adjusted to the specified needs of the users. The identification of precipitation regions in the tested area typical for Lower Silesia region is an important part of a research project, being sponsored by the State Committee for Scientific Research for the years 2001- 2004 (The modelling spatial climate data in GIS no. 8 T12E 042 21).