Ing. Petr Junek
Laboratory of Remote Sensing - Faculty of Civil Engineering, CTU Prague
Thákurova 7, 166 29 Praha 6, Czech Republic
11/2002 - 9/2003 an exchange student at:
Applied Earth Sciences - Faculty of Civil Engineering and Geosciences, TU Delft
Mijnbouwstraat 120, 2628 RX Delft, Netherlands
E - mail: junek@gama.fsv.cvut.cz
The Earth Science Group of Delft University of Technology is involved in research in the Caspian area since 1991. The main goal is to collect data on the impact of sea level change on sedimentary sequences in different time scales and to develop simulation models of fluvial and near shore systems. The two main river systems have been already studied - the modern Volga delta in Russia and the modern Kura delta in Azerbaijan with outcropping offshore Pliocene oil-bearing Paleo-Kura and Paleo-Volga sediments (Productive Series of the South Caspian Basin). A third important South Caspian river system, but not functioning any more, is Paleo-AmuDarya delta in Turkmenistan. The preliminary geological mapping of the Cheleken Peninsula where outcropping Red Series (the coeval equivalents of Productive Series) form the backbone of peninsula was main goal of this study.
High number of geological phenomena - outcropping Pliocene rocks (Red Series), former and recent mud volcanoes, hydrothermal brines rich in Pb and Zn - which can provide significant information to understand sedimentology of South Caspian Basin (SCB) can be found on the Cheleken Peninsula, Turkmenistan.
To test ability of ASTER imagery for mapping of these phenomena and its comparison with other areas located in SCB region was the aim of this research.
For this purpose ASTER Surface Reflectance data (AST_07) were processed. In the first stage all remotely sensed data were geometrically pre-processed (so as to have the same geodetic reference). In the second stage, the different false color composite images and image enhancement techniques were applied to the data and geological photo interpretation was carried out. In the third stage, different band ratio techniques were applied to the data and finally, in the fourth stage, the spectral mapping techniques (as Matched Filtering, ENVI software technique and Variable Multiple Spectral Mixture Analysis, Garcia-Haro - 1999) in order to map different mineral groups were accomplished.
The photo interpretation of enhanced imagery (saturation stretched ASTER 631 bands (as RGB) shows the best results) was useful to obtain basic knowledge of the area and localize main geological phenomena mentioned in literature. Band rationing (ASTER1 / ASTER2) is powerful tool for mapping the Red Series outcrops due its significantly higher values of ratio than other rocks of the Cheleken Peninsula. Different mineral groups (such as AL-OH bearing minerals - Alunite + Phyrophyllite group, Kaolinite group, Muscovite + Illite group; Carbonates + Mg-OH bearing minerals) were mapped using Matched Filtering and VMESMA techniques.
ASTER imagery allowed us to carry out preliminary geological investigation of the area and find encouraging research methods in terms of mapping the main geological phenomena occurring around the peninsula. The results are not confirmed by field spectra or other additional data.
It is important to notice that previously published scientific papers about ASTER data use data only together with further information (field data, airborne hyperspectral data - e.g. AVIRIS) what means that validation of results requires additional spectral measurements in the field or to obtain airborne hyperspectral data.
Petr Junek's stay at Delft University of Technology was supported by Socrates/ERASMUS scholarship.
Earth Science Group TU Delft se zabývá výzkumem v oblasti Kaspického moře od roku 1991. Hlavním vědeckým úkolem výzkumného týmu je sledování sedimentárních procesů v různých časových měřítkách a vytváření modelů ukládání sedimentů v deltách a v příbřežních oblastech. Dvě delty v oblasti jsou již studovány - delta řeky Volha a delta řeky Kura, kde se rovněž nachází výchozy hornin bohatých na ropu (tzv. Productive Series) vytvořených Paleo-Kurou a Paleo-Volhou během pliocénu. Třetím důležitým říčním systémem v oblasti je již nefunkční delta Paleo-Amudarji v Turkmenistánu. Předběžný výzkum Čelekenského poloostrova, kde původní horniny přinesené starým tokem Amudarji vystupují na povrch (tzv. Red Series), byl úkolem tohoto výzkumu.
Na Čelekenském poloostrově v Turkmenistánu se nachází velké množství geologických úkazů - výchozy pliocénních hornin (tzv. Red Series), bývalé a aktivní bahenní sopky, hydrotermální prameny bohaté na olovo a zinek - které mohou poskytnout významnou informaci k porozumění sedimentologie v jižní části Kaspického moře.
Hlavním cílem tohoto výzkumu bylo otestovat možnost použití družicových snímků z radiometru ASTER k mapování výše uvedených jevů a provést jejich porovnání s dalšími oblastmi v regionu.
K tomuto účelu byla použita předzpracovaná data ASTER - Surface Reflectance (AST_07). Nejprve byla provedena geometrické korekce dat (tak aby každý pixel měl známé zeměpisné souřadnice). V druhé fázi byly aplikovány různé barevné syntézy a techniky zvýraznění obrazu a výsledná data byla interpretována. Ve třetí fázi byly použity různé techniky dělení obrazu obrazem a na závěr byla oblast vyhodnocena za účelem mapování různých geologických jednotek pomocí technik spektrální analýzy (Matched Filtering - součást software ENVI).
Interpretace zvýrazněných obrazů umožnila získat základní znalosti o území a lokalizování hlavních geologických jevů popsaných v literatuře (zejména IHS transformace pásem 631 se osvědčila nejvíce). Dělení obrazu obrazem (ASTER1/ASTER2) je významné pro mapování výchozů "Red Series" díky jejich výrazně nižším hodnotám poměru než jiných hornin. Různé skupiny minerálů (např. skupiny alunitu a pyrofylitu, kaolinitu, muskovitu a illitu, horniny obsahující kalcit a skupinu MgOH) byly zmapovány zároveň pomocí technik dělení obrazu obrazem a Matched Filtering.
Družicové snímky z radiometru ASTER umožnily provést předběžný geologický průzkum oblasti a najít využitelné metody pro mapování hlavních geologických jevů objevujících se na poloostrově. Výsledky nejsou potvrzeny měřením v terénu ani pomocí jiných dat. Je důležité zmínit, že veškeré dosud publikované články o datech z radiometru ASTER byly použity právě ve spojení s další informací (měření v terénu, letecká hyperspektrální data - např. AVIRIS).
Pobyt Petra Junka na TU Delft se uskutečnil v rámci programu ERASMUS/SOCRATES.
Remote Sensing finds one of its most important application in the field of geology. During extensive research activity (mostly in the USA and Australia), high number of spectral characteristics of minerals and rocks has been studied. Nowadays, imaging spectrometry producing image scenes which include hundreds or thousands of spectral bands (as well as laboratory data) is the most promising technique in geology. Data of sensors of AVIRIS or HyMap (both carried by aircrafts) have changed during nineties possibilities and techniques of RS. In the beginning of new century has been launched onboard of US Terra Satellite new Advanced Spaceborne Thermal Emission and Reflection Radiometer (ASTER) to collect images containing 14 spectral bands and thus significantly expand the means of geological mapping from space.
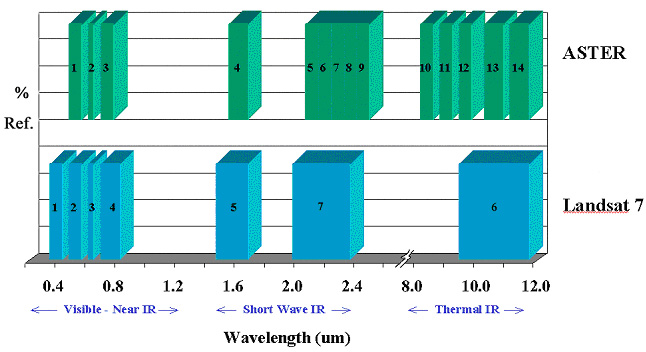
The ASTER sensor was launched in December 1999 on board the Earth Observation System (EOS) US Terra satellite to record solar radiation in 14 spectral bands (fig. 3.). ASTER measures reflected radiation in three bands between 0.52 and 0.86 µm (VNIR) and in six bands from 1.6 to 2.43 µm (SWIR), with 15- respectively 30- meters spatial resolution. Furthermore, ASTER also has a back-looking VNIR telescope with 15-m resolution. Thus, stereoscopic VNIR images can be acquired at 15-m resolution. In addition, emitted radiation measured at 90-m resolution in five bands in the 8.125-11.65 µm wavelength region (TIR). The swath width is 60 km, but ASTER's pointing capability extends the total cross-track viewing capability to 232 km. A very important aspect of the EOS Program is the open availability of the data from all the instruments including on-demand standard products in the low costs. ASTER standard products include VNIR and SWIR surface radiance and reflectance, brightness temperature at the sensor, TIR surface radiance and emissivity, surface kinetic temperature, decorrelation-stretch images and digital-elevation models (DEM).
Jet Propulsion Laboratory of NASA has already in 1995 carried out the prospective capability of ASTER sensor using simulated data from AVIRIS airborne sensor [2]. Conclusions of the study has shown that VNIR data are sensitive to the presence of iron oxide minerals; the SWIR data highlight the presence and differences of minerals with hydroxyl radicals and carbonates, such as clays, alunite, and limestone; the TIR data are sensitive to differences in silica-bearing rocks, either in the presence of or in the absence of the other mineral constituents.
We have used on-demand product ASTER Surface Reflectance (AST_07), which contains surface reflectance for each of the nine VNIR and SWIR bands at 15-m and 30-m resolutions, respectively. The results are obtained by applying an atmospheric correction to radiances reported by the ASTER sensor. The atmospheric correction removes effects due to changes in satellite-sun geometry and atmospheric conditions. The atmospheric correction algorithm is applied to clear-sky pixels only and the results are reported as a number between 0 and 1 [10]. As additional information for support the ASTER Digital Elevation Model has been used.
Several studies have been published during 2001 [11] respectively 2002 [7] on ASTER data evaluation in test sites. Both studies compare precisely geological mapped (by field survey and airborne hyperspectral or multispectral sensors as AVIRIS, AMS-HyMap, Hyperion etc.) areas to test ability of use of ASTER imagery.
Fig 1 - Comparison of ASTER and LANDSAT ETM+ spectral resolution
The processing of ASTER Surface Reflectance data (AST_07) consists of four steps. In the first stage all remotely sensed data were geometrically pre-processed (so as to have the same geodetic reference). In the second stage, the different false color composite images and image enhancement techniques were applied to the data and geological photo interpretation was carried out. In the third stage, different band ratio techniques were applied to the data and finally, in the fourth stage, the spectral mapping techniques (Matched Filtering, ENVI software) in order to map different mineral groups were accomplished.
The first and the second step have already been presented at [14] thus the main aim of this presentation is focused on means of mineral mapping using SWIR bands of ASTER data.
Ratio images designed to display the spectral contrast of specific absorption features have been used extensively in geologic remote sensing and [7] has already applied this remote sensing technique on ASTER data to carry out lithologic mapping in the Mountain Pass, California area. Relative absorption depth (RBD) images are an especially useful three-point ratio formulation for displaying Al-O-H, Mg-O-H and CaCO3 absorption intensities prior to conducting more detailed, time-consuming spectral analysis. For each absorption feature, the numerator is the sum of the bands representing the shoulders (bands 1 and 2), and the denominator is the band located nearest the absorption feature minimum (band 3); removal of continuum increases the intensity of the absorption feature:
RBD = (band 1 + band 2) / band 3
Several different RBD images has been created using ENVI Band Math tool. The ((band 7 + band 9)/band 8) RBD image which highlights the CaCO3 and Mg-O-H absorption feature at 2237.5 nm is affected by higher values of band 9 (see chapter ASTER), thus the presence of absorption feature occurs across whole studied area, with exception of pixels located along NW coast, where sharp fall-off of spectra from band 8 towards band 9 overestimate the higher values of band 9.
In order to eliminate the effect of band 9, the threshold value has been changed to get more presumable result. First is possible to state, the presence of absorption feature is linked with brine activity, the other areas which most likely contain CaCO3 bearing minerals are roads in Cheleken City and on some other places of peninsula. The presence of the band 8 absorption feature differ two areas classified as dunes. Whereas the bright dunes (G) show absorption feature at 2237.5 nm (even without correction of band 9), the dunes close to the north sand bar has some absorption at this wavelength. These dunes have other spectral characteristic then other dunes in the area (more Calcite like then Alunite).
The Al-O-H absorption RBD image ((band 5 + band 7))/band 6) shows that this absorption feature is in general distributed in areas of brines activity, but highly significant is that brines in NE part of Chochrak Ridge does not show presence of Al-O-H groups (and thus can be easily differentiated from the other brines). As other meaningful fact appears that large areas in the SE part of the scene shows presence of Al-O-H Mica absorption as well, but more detailed look at the spectra shows that these areas have broad absorption feature both in Al-O-H Mica and Al-O-H Phyrophillite group. The presence of Al-O-H Mica absorption feature could be caused by stronger brine activity in the past.
The largest areas are covered by Al-O-H Alunite & Phyrophyllite absorption RBD image which occurs on most areas. Generally the pixels belong either to Al-O-H Alunite or to Al-O-H Mica group.
The ((band 5 + band 9)/band 8)) RBD image successfully maps distribution of pixels dominated by deep absorption at 2237.5 nm, which are linked with brine activity located in NE part of Cheleken. The spectra of other brine ponds mapped by this band ratio show both dominating 2237.5 nm absorption and less distinct absorption feature caused by Al-O-H Mica group.
Fig 2a - ASTER SWIR band rationing: CaCO3 and Mg-O-H absorption feature at 2237.5 nm
Fig. 2b - ASTER SWIR band rationing: Al-O-H Mica absorption feature at 2165 nm
Fig 2c - ASTER SWIR band rationing: Al-O-H Alunite & Phyrophyllite absorption deep absorption at 2205 nm
Fig. 2d - ASTER SWIR band rationing: deep absorption at 2237.5 nm
Several spectra of minerals from USGS Spectral library have been resampled to demonstrate major spectral signatures of minerals in SWIR. Minerals characterized by absorption feature near 2165 nm belong to group of AlOH bearing minerals e.g. Pyrophyllite and Alunite. Jarosite represents sulphite mineral and has absorption feature at 2260 nm. Minerals with absorption feature near 2327.5 nm belongs either to CaCO3 or MgOH bearing minerals - this group of minerals represent Calcite, Chlorite or Talc. Group of minerals which has absorption feature near 2205 nm is represented by Montmorillonite, Kaolinite, Muscovite or Illite. Whilst will be not possible to map particular minerals using ASTER imagery, it will be possible to differentiate between mentioned mineral groups.

Fig. 3 - Spectral signatures of minerals
Selecting of different types of endmembers which represent spectrally most extreme pixels in the scene has been provided by support of pixel purity index technique (PPI). PPI is a means of finding the most "spectrally pure" pixels typically correspond to mixing endmembers. The PPI is computed by repeatedly projecting n-dimensional scatterplots onto a random unit vector. The extreme pixels in each projection are recorded and the total number of times each pixel is marked as extreme is noted [8].
The spectra with specific spectral characteristics or of areas important for geological setting has been also studied, but have not been noted as extreme and are not used for spectral analyses. The image scene has been divided into several areas according to conclusions of image interpretation and has been focused to map geological and geographical phenomena occurring on peninsula.
Matched filtering is an ENVI software technique which performs partial unmixing - finding the abundances of user defined endmembers. Not all of the endmembers in the image need to be known. This technique maximizes the response of the known endmember und suppresses the response of the composite unknown backgroung, thus "matching" the known signature. It provides a rapid means detecting specific materials based on matches to library or image endmember spectra and does not require knowledge of all endmembers within an image scene [8].
Bands 4-9 have been processed by Matched Filtering in order to map area according to its SWIR spectral signatures. Following spectra have been collected:
a) WpoolW - which represents the pixels with 2205 nm absorption, no pixels with absorption at 2205 and without absorption at 2237.5 nm at the same time have been found in the image scene.
b) Solonchak - represents pixel with deepest absorption feature at 2165 nm
c) Dunes bright - represents pixels with absorption at 2165 nm and with no absorption at 2237.5 nm
d) Top of duine - represents pixels with absorption at 2165 nm and 2237.5 nm
e) NE pool - represents pixels with deep absorption at 2237.5 nm
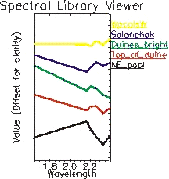
Fig. 4 - Input spectra to Matched Filtering
The study area has been successfully mapped using matched filtering procedure. Results of matched filtering are shown as three endmembers colour composite (in red, green respectively blue colour) where higher matches are represented by brighter pixels.
Fig. 5 shows pixels with deep absorption feature at 2237.5 nm (CaCO3 & MgOH bearing minerals) in red, pixels with absorption features at 2165 nm and 2237.5 nm in blue and pixels with absorption feature at 2205 nm in green. The randomly collected spectra of bright pixels demonstrate that technique is able to classify image according to spectra signatures. Fig.6 shows western part of Red Series outcrops where pixels with different spectral signatures are mapped.
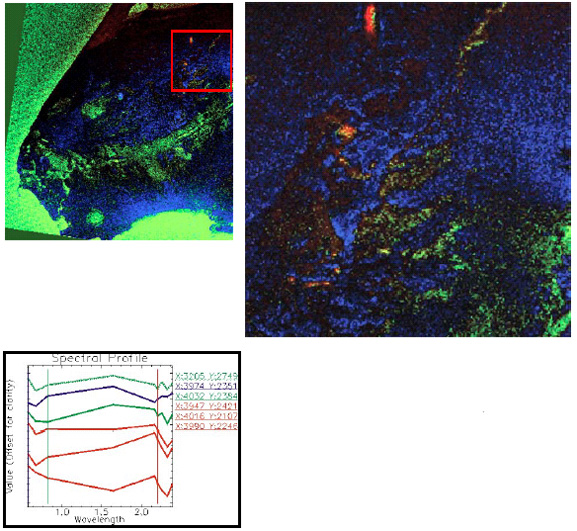
Fig.5 - Results of Matched Filtering technique - spectra of bright pixels shows that blue spectra (in image shown as blue) are dominated by absorption at 2165 nm, red spectra is dominated by absorption at 2237.5 nm and green have absorption both at 2205 nm and 2237.5 nm
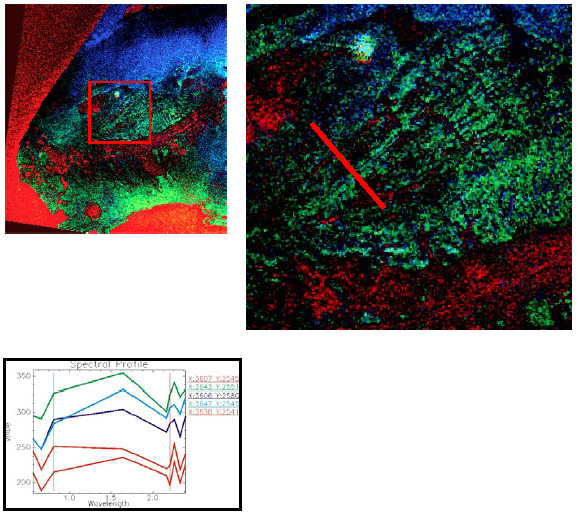
Fig.6 - The matched filtered image of west part of Red Series shows different spectral signatures along the profile. Red pixels have absorption feature at 2205 nm and 2237.5 nm, green and blue have absorption both 2165 nm and 2237.5 nm, when green one have deeper the first absorption feature and blue ones the later.
Analysis of ASTER spectral reflectance data of Cheleken Peninsula provides promising results. ASTER imagery allowed us to carry out preliminary geological investigation of the area and find encouraging research methods in terms of mineral mapping. Band rationing is a mean to provide basic information about mineral groups around the peninsula. By Matched Filtering technique surprising facts have been discovered - two types of areas influenced by brine activity and bedding like distribution of rocks in the west part of Red Series outcrops.
The results are not confirmed by field spectra or other additional data. It is important to notice that previously published scientific papers about ASTER data use data only together with further information (field data, airborne hyperspectral data - e.g. AVIRIS).